Discover how a bimodal integration strategy can address the major data management challenges facing your organization today.
Get the Report →


Power BI Analytics for MongoDB Data in Real-Time
Power BI is expanding self-service data prep to help business analysts extract insights from Big Data and introduce enterprise BI platform capabilities. With recent updates, Power BI has enabled connectivity to more data sources than ever before. That said, no product is able to do everything, which is where the CData Power BI Connectors come in.
With CData, you get live connectivity to data in Power BI (meaning DirectQuery) from any of the 300+ supported sources, ranging from CRM and marketing automation to big data and NoSQL. With CData Connectors, you can access MongoDB data faster than you can with any other connector on the market, and leverage the built-in modeling and data flattening features to create a table-like model of your schema-less data, ready to be viewed and analyzed in Power BI – no code or data curation required.
Making MongoDB data look relational
Our connectors provide the fastest and most flexible support for NoSQL data integration, allowing you to interact with NoSQL databases as if they were relational and leverage the flexibility of NoSQL data storage with the familiarity and utility of SQL-92 queries.
CData Connectors include several features for mapping or flattening existing NoSQL data structures (like JSON objects, arrays, etc.) to simplify integration with Power BI. The options range from free-form queries to horizontal and vertical flattening to custom schema definitions. While we discuss flattening in brief below, you can read this Knowledge Base article to learn more.
Sample document
The following is a sample document for the listingsAndReviews collection, which you can load into your own MongoDB Atlas instance to follow along with this article.
You can read more about the collection here.
{
  "_id": "10082422",
  "listing_url": "https://www.airbnb.com/rooms/10082422",
  "name": "Nice room in Barcelona Center",
  "summary": "Hi!  Cozy double bed room...",
  "description": "Hi!  Cozy double bed...",
  ...
  "property_type": "Apartment",
  ...,
  "bedrooms": {
    "$numberInt": "1"
  },
  ...,
  "amenities": [
    "Internet",
    "Wifi",
    ...
  ],
  "price": {
    "$numberDecimal": "50.00"
  },
  "monthly_price": {
    "$numberDecimal": "750.00"
  },
  "security_deposit": {
    "$numberDecimal": "100.00"
  },
  ...,
  "images": {
    ...
  },
  "host": {
    ...
  },
  "address": {
    "street": "Barcelona, Catalunya, Spain",
    "suburb": "Eixample",
    "government_area": "la Dreta de l'Eixample",
    "market": "Barcelona",
    "country": "Spain",
    "country_code": "ES",
    "location": {
      "type": "Point",
      "coordinates": [
        {
          "$numberDouble": "2.16942"
        },
        {
          "$numberDouble": "41.40082"
        }
      ],
      "is_location_exact": true
    }
  },
  "availability": {
    ...
  },
  "review_scores": {},
  "reviews": []
}
The relational model
With this document in mind, we configure the CData Connector to build a schema based on the hierarchy of the data, using dot notation and array indexes to drill down into the data.
| Field Name in Power BI | MongoDB Reference | Value |
|---|---|---|
| _id | _id | 5780046cd5a397806c3dab3 |
| longitude | address.location.coordinates.0 | 2.16942 |
| latitude | address.location.coordinates.1 | 41.40082 |
| is_location_exact | address.location.is_location_exact | true |
| country | address.country | China |
| price | price | 80.00 |
| property_type | property_type | Apartment |
| monthly_price | monthly_price | 750.00 |
| security_deposit | security_deposit | 100.00 |
| bedrooms | bedrooms | 1 |
Drilling down into the MongoDB data to build this schema is as easy as setting a few configuration properties and then modifying the generated file to change the names of the fields.
Configuring the connector
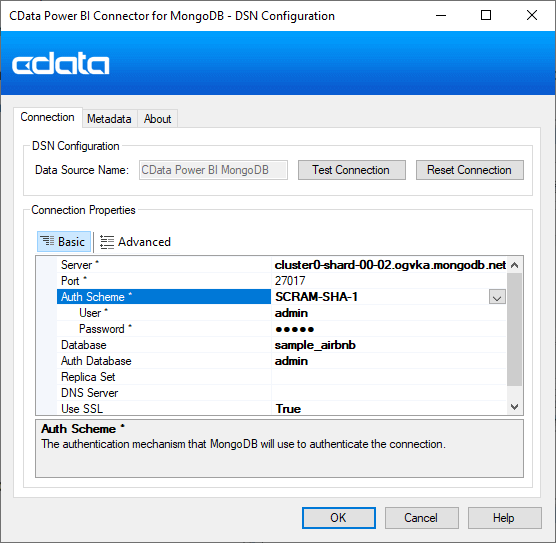
Download the CData MongoDB Power BI Connector here. Follow the instructions below when going through the DSN Configuration wizard, so that we may connect to our MongoDB Atlas primary instance. If ever you need to modify these properties, you can always execute the included ODBCConfigure.exe application.
- Authentication: Set the Auth Scheme, Server, Port, User, Password, Database, and Auth Database properties to connect to your MongoDB instance. Also, remember to set Use SSL to "True".
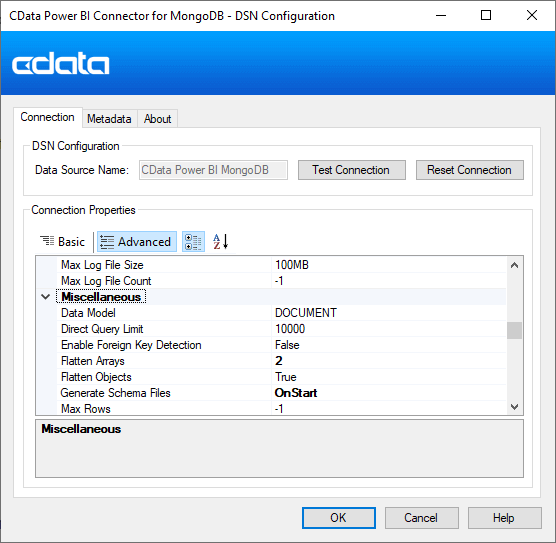
- Miscellaneous: On the Advanced tab, set the Flatten Arrays property to "2", set Flatten Objects to "True" and set Generate Schema Files to "OnStart".
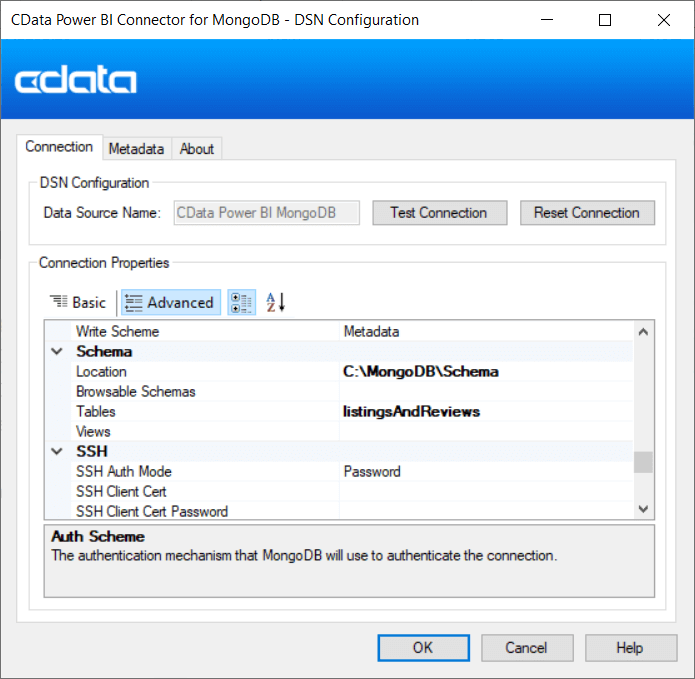
- Schema: Still on the Advanced tab, set Location to the directory for your schema files and (optionally) set the Tables property to "listingsAndReviews" to only work with the listingsAndReviews collection.
With the connection properties configured, click "Test Connection" to ensure the properties are properly configured and to generate the schema file.
The schema file
Open the generated schema file (.rsd) to see the table/column definitions. Each column has specific attributes (like whether or not the column is read-only, its source datatype, and more).
For this example, we simply edit the existing schema definition, removing unwanted columns and changing the name attribute for other columns (note the attributes have been truncated for readability).
<attr name="_id" xs:type="string" key = "true" other:bsonpath = "$._id"/>
<attr name="longitude" xs:type="double" other:bsonpath = "$.address.location.coordinates.0"/>
<attr name="latitude" xs:type="double" other:bsonpath = "$.address.location.coordinates.1"/>
<attr name="is_location_exact" xs:type="bool" other:bsonpath = "$.address.location.is_location_exact"/>
<attr name="country" xs:type="string" other:bsonpath = "$.address.country"/>
<attr name="price" xs:type="decimal" other:bsonpath = "$.price"/>
<attr name="property_type" xs:type="string" other:bsonpath = "$.property_type"/>
<attr name="monthly_price" xs:type="decimal"other:bsonpath = "$.monthly_price"/>
<attr name="security_deposit" xs:type="decimal" other:bsonpath = "$.security_deposit"/>
<attr name="bedrooms" xs:type="int" other:bsonpath = "$.bedrooms"/>
Live MongoDB data in Power BI
Once the connection and schema file are both configured, you can view live MongoDB data in Power BI. Since the CData Connector is built using the Custom Connector interface, you have to option to pull the MongoDB data into memory (Import) or connect live (DirectQuery).
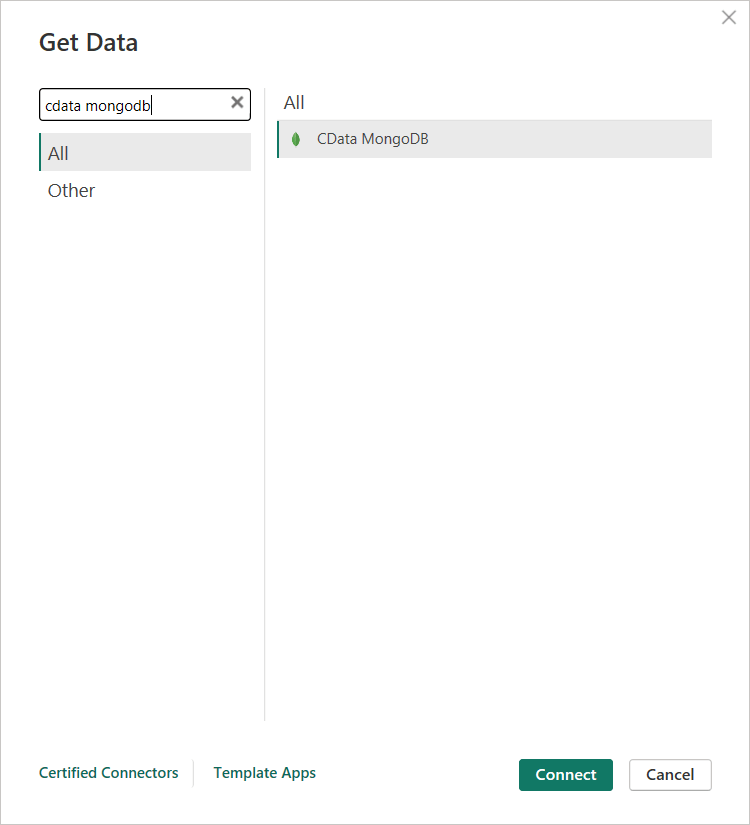
- Click Get Data, search for "CData MongoDB" (or click Other and scroll to CData MongoDB) and click Connect.
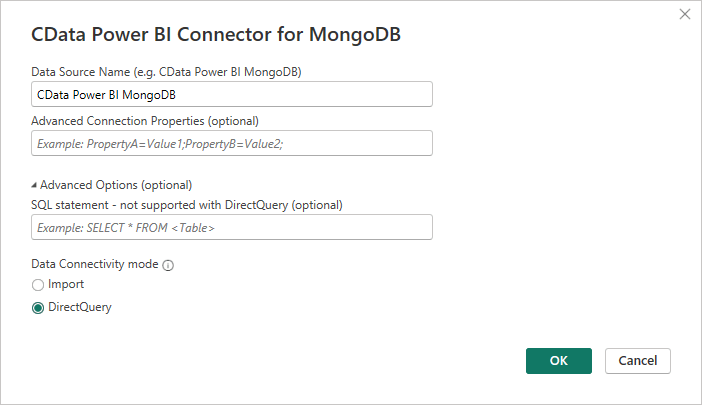
- Next, type the DSN you configured earlier, select Import or DirectQuery, and click OK.
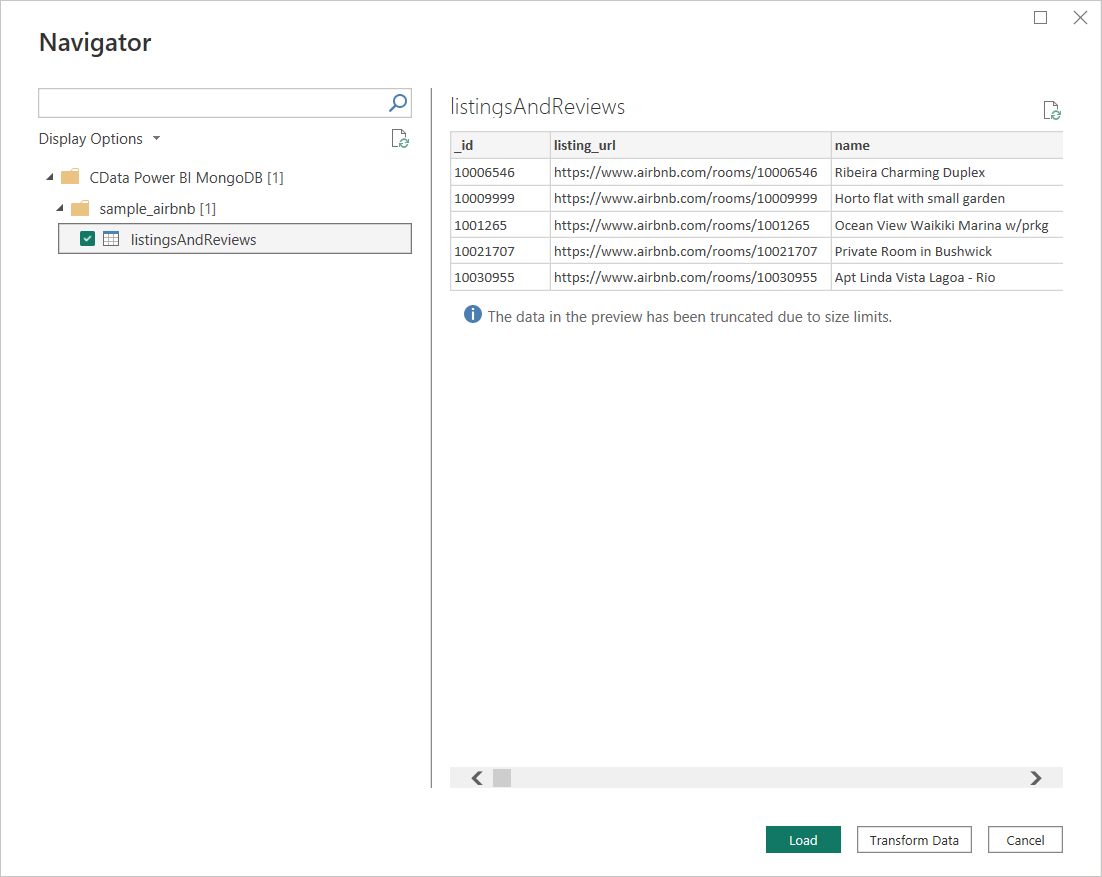
- Select the table (i.e. listingsAndReviews) and click Load.
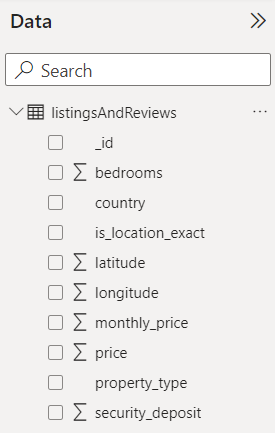
- At this point, you will have access to the listingsAndReviews data (as defined by the schema file) in Power BI, as seen in the Data menu in Power BI.
Since the CData Power BI Connector allows direct connectivity to MongoDB from Power BI, you can bypass the traditional data replication or virtualization steps associated with working on SaaS and NoSQL data and jump straight into building visualizations and reports.
Visualizing MongoDB data in Power BI
Now that we've established a live connection to our MongoDB data, we're ready to build visualizations in Power BI. There are many distinguishing parts of the listingsAndReviews data. Thanks to built-in location mapping, we can build a map of the listings by property type, using the latitude and longitude.
For starters, let's build the map..
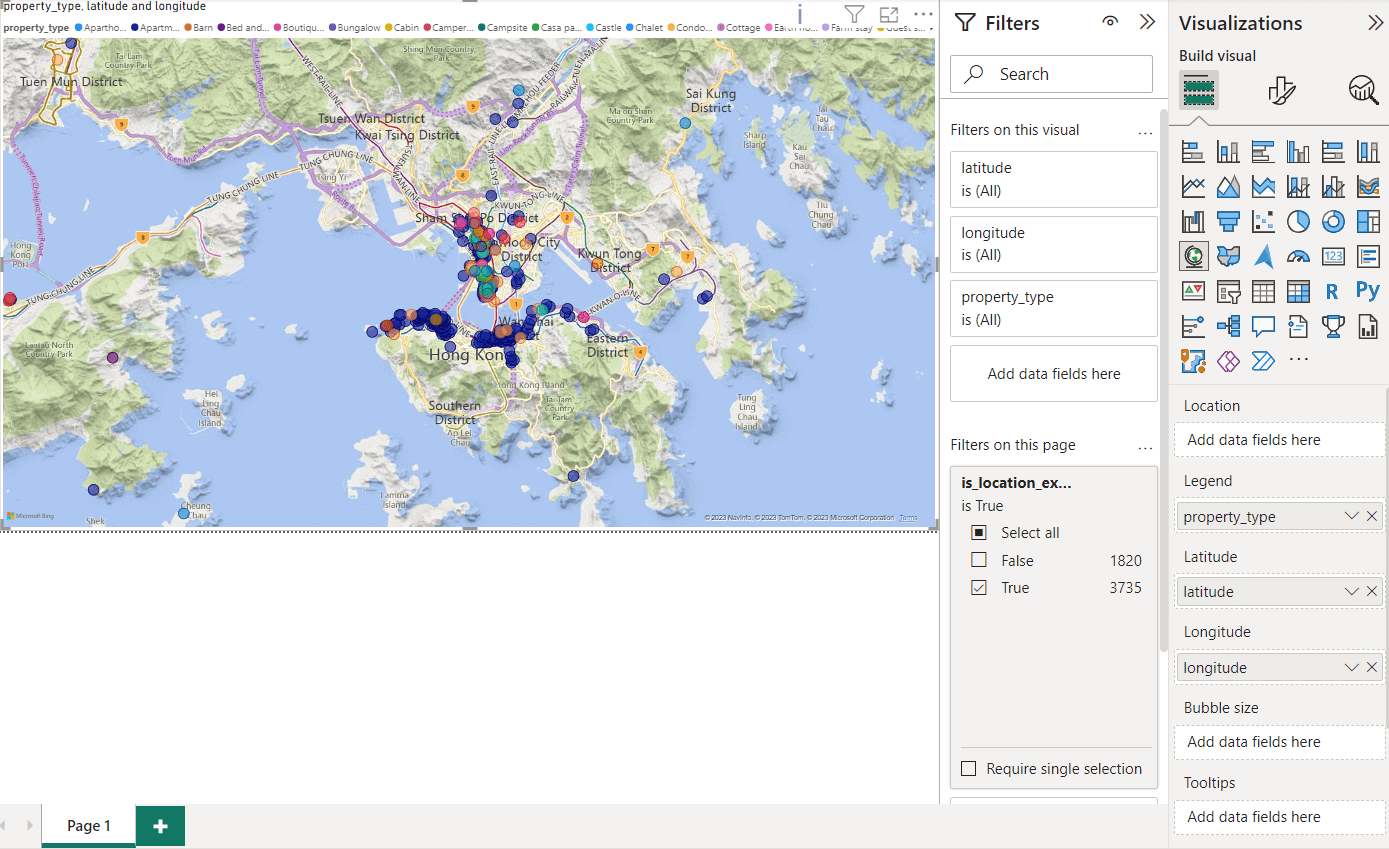
Building a map visualization
- Click on the Map icon in the Visualizations menu.
- Drag latitude and longitude to the corresponding Fields in the Visualizations menu.
- Drag property_type to the Legend field.
- Finally, drag is_location_exact to the Filters section and select True.
Now you have a Map chart that plots each listing, colored by the property type.
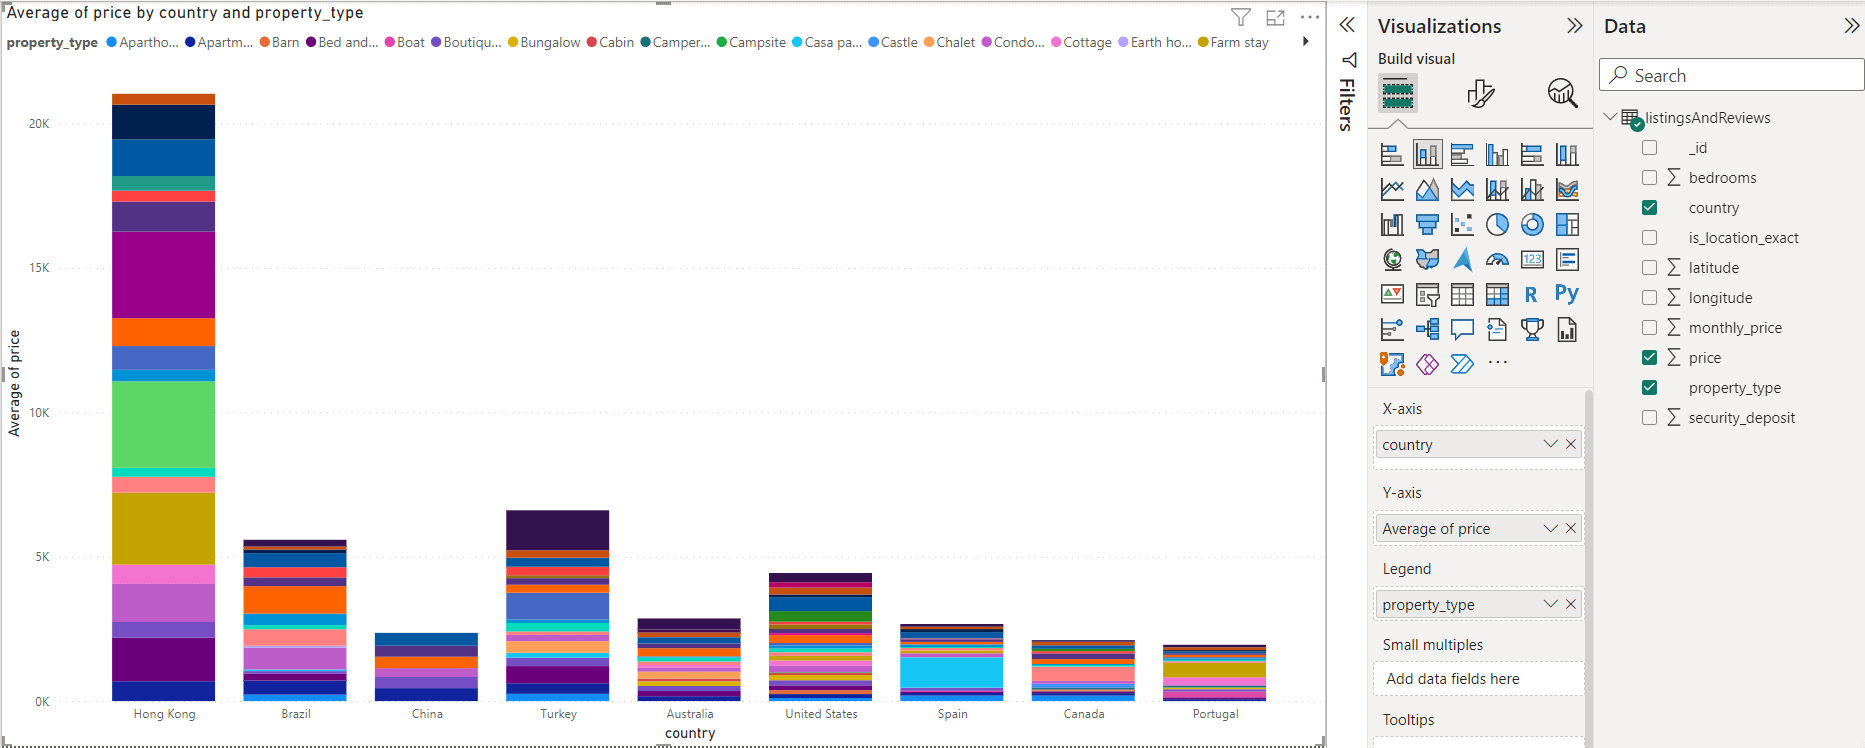
Building a Stacked Column Chart
- Click on the Stacked column chart icon in the Visualizations menu.
- Drag address_country to the X-axis field.
- Drag price to the Y-axis field, select the dropdown and then click Average.
- Drag property_type to the Legend field.
Now you have a Stacked column chart that shows the average price, by property type, in multiple different countries.
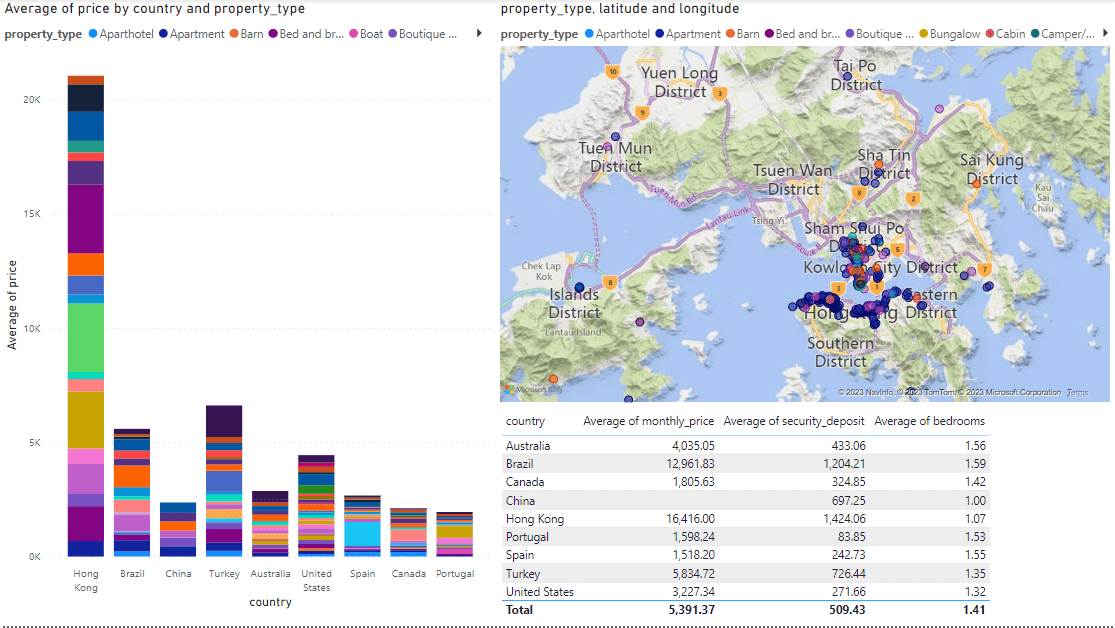
More visualizations
We went through the process of building a report with an additional table to show the average monthly price, average security deposit, and average number of bedrooms by country. In this report, you can use the focus functionality of Power BI to select a country and filter your report by the selected country.
What is Power BI?
Microsoft Power BI is a business intelligence (BI) tool that enables users to visualize and analyze data from various sources across their tech stack. It allows users to create interactive reports and dashboards that provide insights into business and sales health and other key performance indicators.
Features of Power BI
- Interactive dashboards: Create easy-to-use, dynamic dashboards that provide a visual of key information across your business.
- Easy set-up: The tool is free to download and quick to set up.
- Customizable: The custom visualization library enables you to create dashboards that suit your needs.
- Real-time data: Power BI makes data available in real time, giving you an up-to-date view into your business.
What is MongoDB?
MongoDB is a popular open-source NoSQL document database designed for flexibility and scalability.
Features of MongoDB
- Schema-less: MongoDB stores data in flexible, JSON-like documents that handle complex data and evolving schemas.
- Replication: MongoDB runs on multiple servers, with data duplicated across them to ensure your data is backed up in case of failure.
- Indexing: MongoDB offers various indexing options, including compound indexes and geospatial indexes, to optimize query performance.
- High performance: MongoDB is designed for high-performance read and write operations, making it suitable for applications with demanding throughput requirements.
Free trial & more information
Thanks to the CData Power BI Connectors, users can connect Power BI to live data from SaaS, Big Data, and NoSQL sources to perform analytics and build visualizations to drive business.
Get started with a free, 30-day trial of any of the Power BI Connectors. For more videos, head over to our YouTube channel. As always, let us know if you have any questions during your evaluation. Our world-class CData Support team is always available to help.
Data Connectors
ETL/ ELT Solutions
Cloud & API Connectivity
OEM & Custom Drivers