ノーコードでクラウド上のデータとの連携を実現。
詳細はこちら →Facebook Ads Data Provider の30日間無償トライアルをダウンロード
30日間の無償トライアルへCData


こんにちは!ウェブ担当の加藤です。マーケ関連のデータ分析や整備もやっています。
Facebook Ads 用の CData ADO.NET プロバイダーはサードパーティーコントロールで使うことのできる通常のADO.NET データベースアクセスコンポーネントを実装しています。データバインドするための通常のADO.NET プロセスに従うことで、UI コントロールから実データへの双方向アクセスを可能にします。 この記事では、CData を使ってDevExpress Windows Forms とウェブコントロールにデータバインドする方法を説明します。ここでは、最新のデータを表示するチャートにデータバインドします。
ほとんどのテーブルで、アプリケーション認証と同様にユーザー認証を必要とします。Facebook Ads はユーザー認証にOAuth 標準を使用しています。Facebook への認証には、組み込み認証を使用してブラウザ経由で完結することもできますし、Facebook にアプリを登録することで独自のOAuthClientId、OAuthClientSecret、CallbackURL を取得することもできます。
の設定方法については、ヘルプドキュメントの「OAuth」セクションを参照してください。
任意で以下の項目を設定して、フィルタリングや集計を行うもできます。必要に応じてご利用ください。
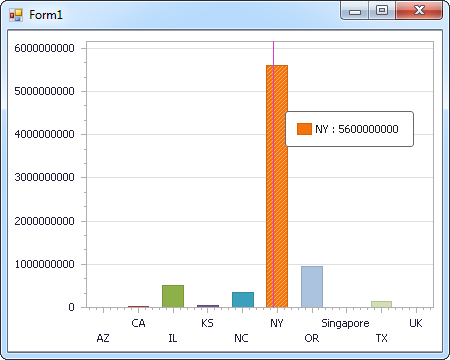
下のコードでは、Facebook Ads でDevExpress のチャートに追加する方法を説明します。FacebookAdsDataAdapter はチャートコントロールのSeries プロパティにバインドします。コントロールのDiagram プロパティはx 軸とy 軸をカラム名として定義します。
using (FacebookAdsConnection connection = new FacebookAdsConnection(
"")) {
  FacebookAdsDataAdapter dataAdapter = new FacebookAdsDataAdapter(
  "SELECT AccountId, Name FROM AdAccounts WHERE Name = 'Acct Name'", connection);

  DataTable table = new DataTable();
  dataAdapter.Fill(table);
  DevExpress.XtraCharts.Series series = new DevExpress.XtraCharts.Series();
  chartControl1.Series.Add(series);
  DataTable table = new DataTable();
  series.ValueDataMembers.AddRange(new string[] { "Name" });
  series.ArgumentScaleType = DevExpress.XtraCharts.ScaleType.Qualitative;
  series.ArgumentDataMember = "AccountId";
  series.ValueScaleType = DevExpress.XtraCharts.ScaleType.Numerical;
  chartControl1.Legend.Visibility = DevExpress.Utils.DefaultBoolean.False;
  ((DevExpress.XtraCharts.SideBySideBarSeriesView)series.View).ColorEach = true;
}
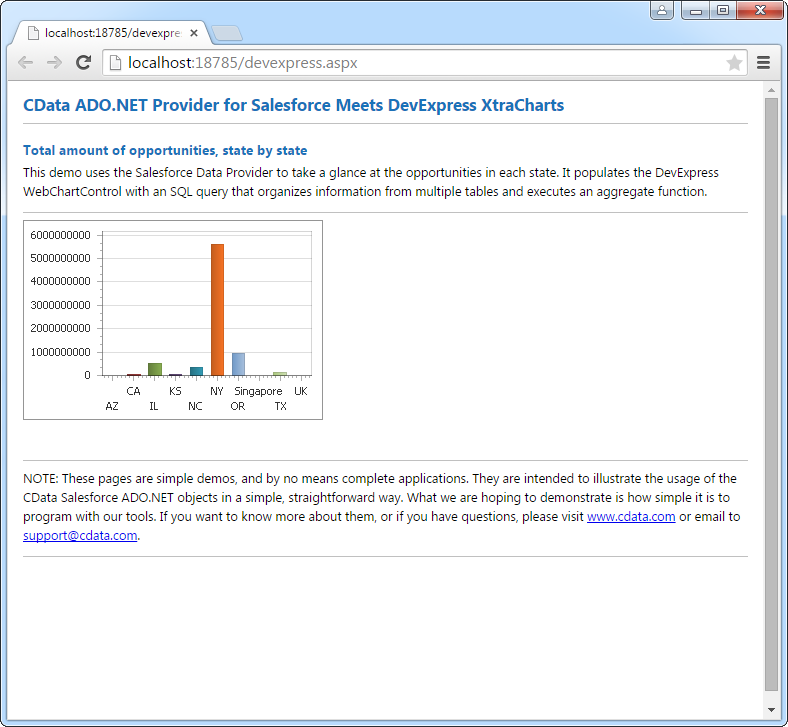
下のコードではFacebook Ads でDevExpress Web を操作するための設定方法を説明します。FacebookAdsDataAdapter はチャートのSeries プロパティにバインドします。Diagram プロパティはx 軸とy 軸をカラム名として定義します。
using DevExpress.XtraCharts;

using (FacebookAdsConnection connection = new FacebookAdsConnection(
""))
{
  FacebookAdsDataAdapter FacebookAdsDataAdapter1 = new FacebookAdsDataAdapter("SELECT AccountId, Name FROM AdAccounts WHERE Name = 'Acct Name'", connection);
  DataTable table = new DataTable();
  FacebookAdsDataAdapter1.Fill(table);
  DevExpress.XtraCharts.Series series = new Series("Series1", ViewType.Bar);
  WebChartControl1.Series.Add(series);
  DataTable table = new DataTable();
  series.ValueDataMembers.AddRange(new string[] { "Name" });
  series.ArgumentScaleType = ScaleType.Qualitative;
  series.ArgumentDataMember = "AccountId";
  series.ValueScaleType = ScaleType.Numerical;
  ((DevExpress.XtraCharts.SideBySideBarSeriesView)series.View).ColorEach = true;
}