ノーコードでクラウド上のデータとの連携を実現。
詳細はこちら →ShipStation ODBC Driver の30日間無償トライアルをダウンロード
30日間の無償トライアルへ製品の詳細
ShipStation ODBC Driver を使って、ODBC 接続をサポートするあらゆるアプリケーション・ツールからShipStation にデータ連携。
ShipStation データにデータベースと同感覚でアクセスして、ShipStation データに使い慣れたODBC インターフェースで連携。
こんにちは!ドライバー周りのヘルプドキュメントを担当している古川です。
Crystal Reports には、ODBC 標準向けのサポートが組み込まれています。CData ODBC Driver for ShipStation は、Crystal Reports でレポート作成ウィザードやその他のツールを使ってShipStation へのアクセスを可能にします。この記事では、ShipStation の機能を持つシンプルな帳票を作成する方法を説明します。
CData ODBC ドライバは、以下のような特徴を持ったリアルタイムデータ連携ソリューションです。
CData ODBC ドライバでは、1.データソースとしてShipStation の接続を設定、2.Crystal Reports 側でODBC Driver との接続を設定、という2つのステップだけでデータソースに接続できます。以下に具体的な設定手順を説明します。
まずは、本記事右側のサイドバーからShipStation ODBC Driver の無償トライアルをダウンロード・インストールしてください。30日間無償で、製品版の全機能が使用できます。
下記の手順に従って、レポート作成ウィザードを使ってShipStation 接続を作成します。
Microsoft ODBC データソースアドミニストレーターで必要なプロパティを設定する方法は、ヘルプドキュメントの「はじめに」をご参照ください。
ShipStation への接続には、BASIC 認証標準を使います。
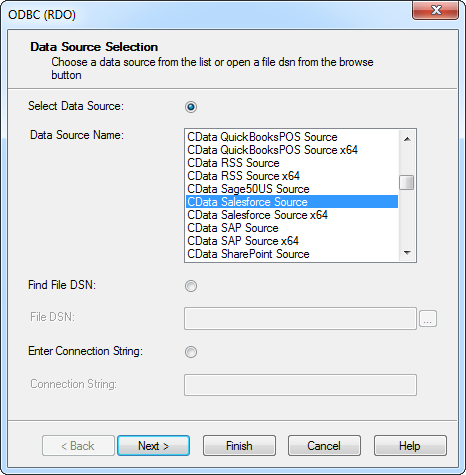
新しい帳票で、[Create New Connection]>[ODBC]をクリックします。
ODBC 接続をShipStation に追加したら、レポート作成ウィザードを使ってShipStation を帳票に追加できます。
帳票に必要なテーブルやフィールドを選択して、データソースを設定します。この例では、Tags テーブルのId およびColor カラムを使います。
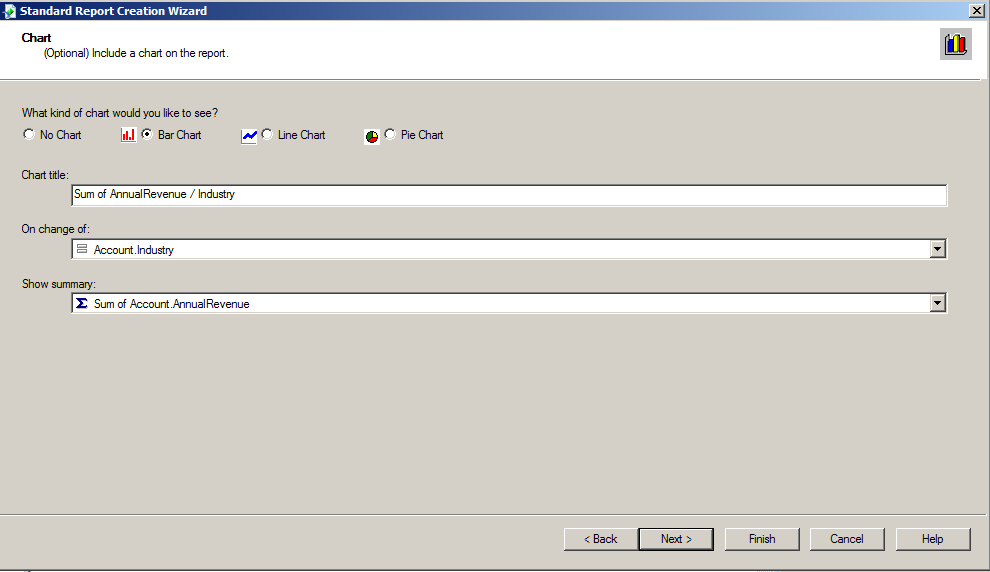
チャートの種類を設定。 例えば、Color をId で表すシンプルなチャートを作成します。 ウィザードを完了すると、Crystal Reports はShipStation に実行されるSQL クエリをビルドします。ドライバーは、リアル隊うShipStation に対してクエリを実行します。
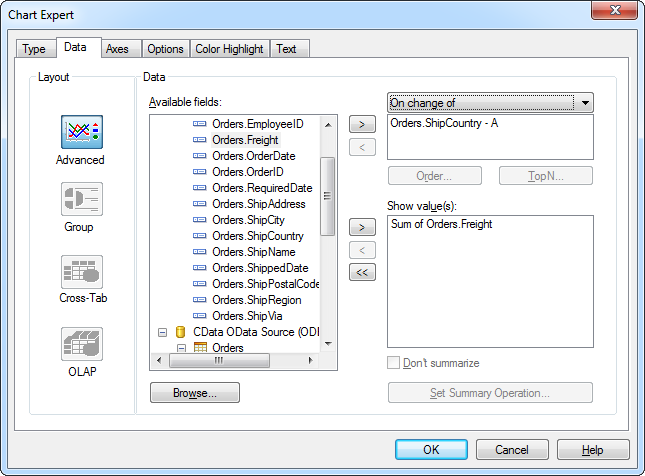
データのインポートが終わったら、レポートフィールドをサマライズもしくはソートするチャートやレポートオブジェクトを作成できます。[Insert]>[Chart]をクリックして、チャートエキスパートを開きます。Total Color by Id を表すグラフを作成するには、Id を[On Change Of]メニューセレクションの下のボックスに追加してからColor を[Show Values]の下のボックスに追加します。
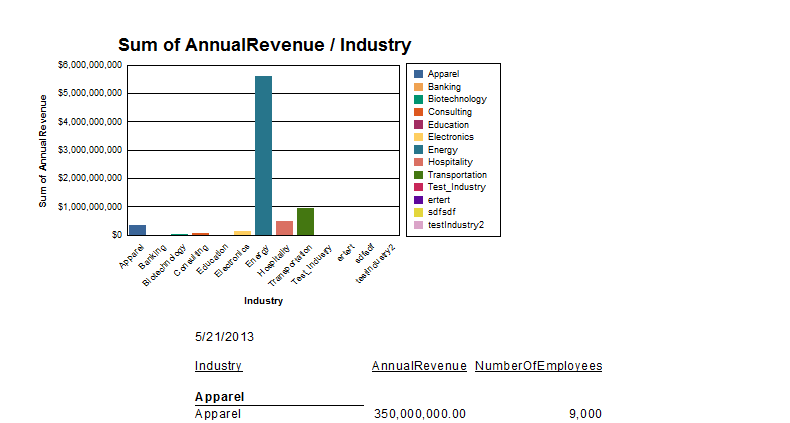
完成した帳票をプレビューして、チャートにデータが入っていることを確認します。Null 値を取り除きたい場合は、SelectionFormula を使います。
このようにCData ODBC ドライバと併用することで、270を超えるSaaS、NoSQL データをコーディングなしで扱うことができます。30日の無償評価版が利用できますので、ぜひ自社で使っているクラウドサービスやNoSQL と合わせて活用してみてください。
CData ODBC ドライバは日本のユーザー向けに、UI の日本語化、ドキュメントの日本語化、日本語でのテクニカルサポートを提供しています。