Discover how a bimodal integration strategy can address the major data management challenges facing your organization today.
Get the Report →


Databind Charts to Salesforce Data
Databinding enables bidirectional access to data from UI controls. You can use the CData ADO.NET Provider for Salesforce to easily databind Salesforce data to Windows Forms and Web controls in Visual Studio. This article shows how to use wizards to databind Salesforce data to a chart that reflects any changes. The code walk-through section shows how to create the same chart in 10 lines of code.
Databind to a Chart
Databinding consists of three steps: Instantiate the control, configure the data source, and databind. In the following section, you will use the Data Source Configuration wizard to accomplish these three steps. In the code walk-through section, you will recreate the same chart from code.
Configure the Connection and Select Database Objects
Follow the procedure below to use the Data Source Configuration Wizard to create a chart control and create a connection to Salesforce. In the wizard, you can select the Salesforce entities you want to databind.
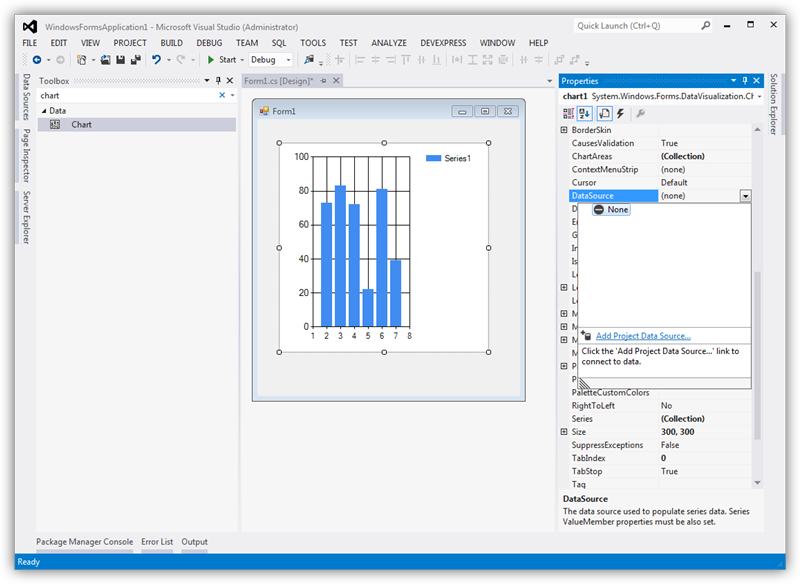
- In a Windows Forms project, drag and drop a Chart control from the toolbox to the form. In the Chart properties, select DataSource and then select Add Project Data Source from the menu.
![]()
- In the Data Source Configuration Wizard that appears, select Database -> Dataset.
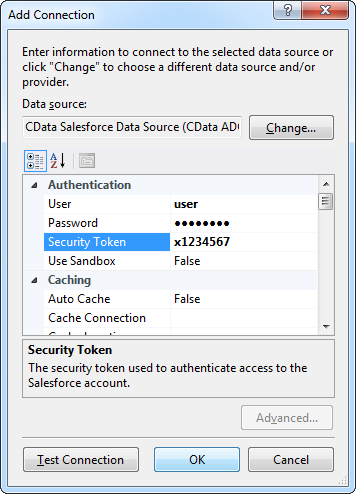
- In the Choose Your Data Connection step, click New Connection.
In the Add Connection dialog, click Change to select the CData Salesforce Data Source and enter connection properties. Below is a typical connection string:
User=user;Password=password;AccessToken=x12345;
![]()
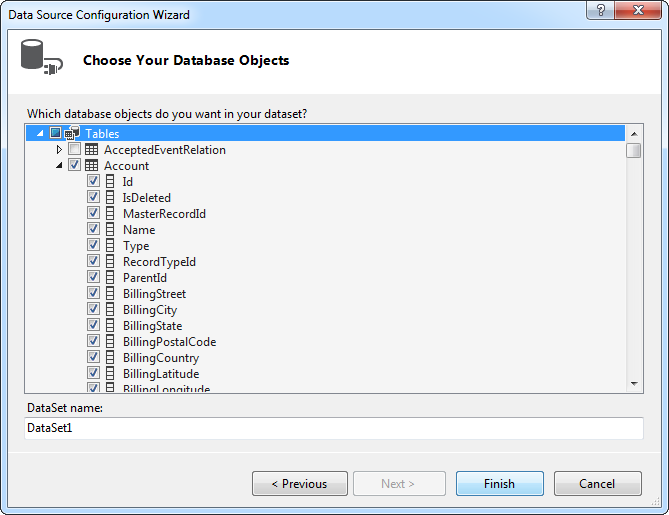
- Choose the database objects you want to work with. This example uses the Account table.
![]()
Databind
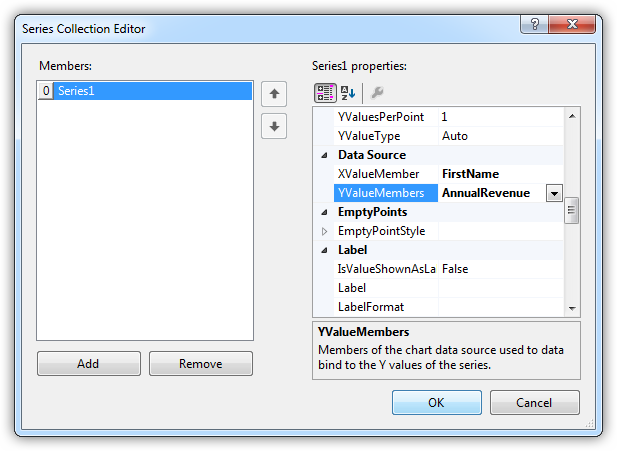
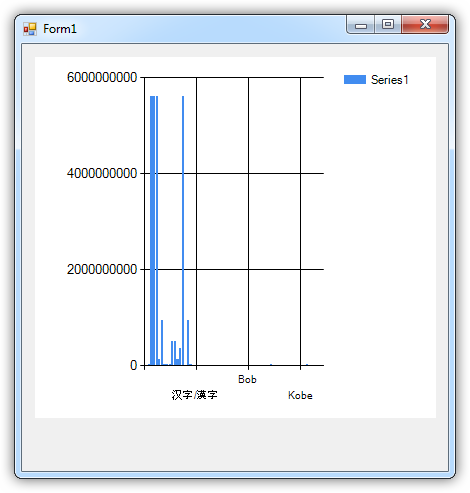
After adding the data source and selecting database objects, you can bind the objects to the chart. This example assigns the x-axis to FirstName and the y-axis to AnnualRevenue.
- In the Chart properties, click the button in the Series property to open the Series Collection Editor.
- In the Series properties, select the columns you want for the x- and y-axes: Select columns from the menu in the XValueMember and YValueMember properties.
The chart is now databound to the Salesforce data. Run the chart to display the current data.
Code Walk-through
Databinding to Salesforce data requires only a few lines of code and can be completed in three easy steps.
- Initialize the connection.
- Create a SalesforceDataAdapter to execute the query and create a DataSet to be filled with its results.
- Databind the result set to the chart.
Below is the complete code, resulting in the same chart shown above:
SalesforceConnection conn = new SalesforceConnection("User=user;Password=password;AccessToken=x12345;");
SalesforceCommand comm = new SalesforceCommand("SELECT Contact.FirstName, SUM(Account.AnnualRevenue) FROM Contact, Account GROUP BY Contact.FirstName", conn);
SalesforceDataAdapter da = new SalesforceDataAdapter(comm);
DataSet dataset = new DataSet();
da.Fill(dataset);

chart1.DataSource = dataset;
chart1.Series[0].XValueMember = "FirstName";
chart1.Series[0].YValueMembers = "AnnualRevenue";
// Insert code for additional chart formatting here.
chart1.DataBind();
Chart Sample Project
To help you begin charting using the CData Provider for Salesforce, download the fully functional sample project.
Data Connectors
ETL/ ELT Solutions
Cloud & API Connectivity
OEM & Custom Drivers