Discover how a bimodal integration strategy can address the major data management challenges facing your organization today.
Get the Report →


Using the CData Data Providers with the DevExpress Data Grid
The CData ADO.NET providers are standards-based libraries that can be used with various third-party components and tools. You can use the DevExpress controls with any of the CData providers to visualize data from a wide variety of sources.
In this article, you will use the provider to databind to the DevExpress Windows Forms and Web controls. The standard ADO.NET process for databinding can be followed to enable bidirectional access to live data from UI controls. This article shows how to databind to a DevExpress chart that displays current data.
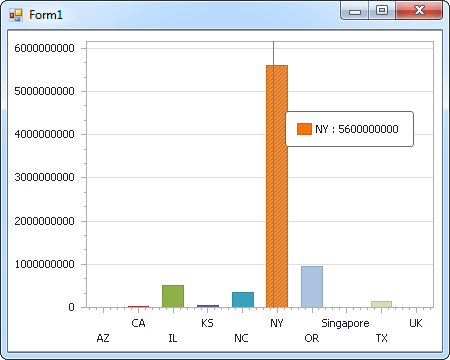
Windows Forms Controls
The code below shows how to populate a DevExpress chart, ChartControl1, with Salesforce data. The SalesforceDataAdapter binds to the Series property of ChartControl1; the Diagram property of WebChartControl1 defines the x- and y-axes as the column names.
using (SalesforceConnection connection = new SalesforceConnection(
"user=myuser;password=mypassword;SecurityToken=mysecuritytoken")) {
  SalesforceDataAdapter dataAdapter = new SalesforceDataAdapter(
  "Select A.BillingState, SUM(O.Amount) AS SUM_O_Amount From  Opportunity O, Account A Group By A.BillingState", connection);
  DataTable table = new DataTable();
  dataAdapter.Fill(table);
  DevExpress.XtraCharts.Series series = new DevExpress.XtraCharts.Series();
  chartControl1.Series.Add(series);
  series.DataSource = table;
  series.ValueDataMembers.AddRange(new string[] { "SUM_O_Amount" });
  series.ArgumentScaleType = DevExpress.XtraCharts.ScaleType.Qualitative;
  series.ArgumentDataMember = "BillingState";
  series.ValueScaleType = DevExpress.XtraCharts.ScaleType.Numerical;
  chartControl1.Legend.Visibility = DevExpress.Utils.DefaultBoolean.False;
  ((DevExpress.XtraCharts.SideBySideBarSeriesView)series.View).ColorEach = true;
}
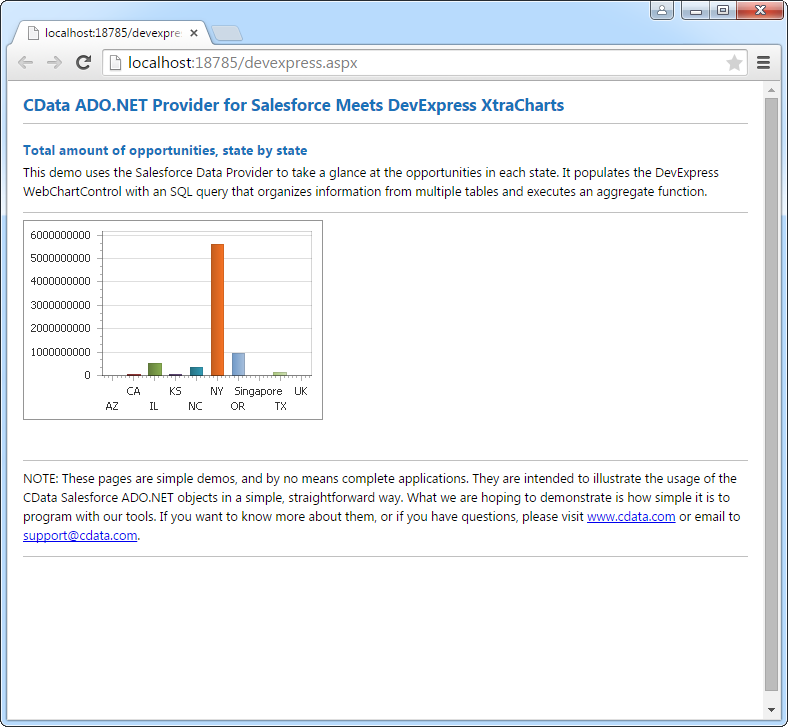
Web Controls
The code below shows how to populate a DevExpress Web control with Salesforce data. The SalesforceDataAdapter binds to the Series property of the chart, WebChartControl1; the Diagram property of WebChartControl1 defines the x- and y-axes as the column names.
using (SalesforceConnection connection = new SalesforceConnection(
"user=myuser;password=mypassword;SecurityToken=mysecuritytoken")) {
  SalesforceDataAdapter dataAdapter = new SalesforceDataAdapter(
  "Select A.BillingState, SUM(O.Amount) AS SUM_O_Amount From  Opportunity O, Account A Group By A.BillingState", connection);
  DataTable table = new DataTable();
  dataAdapter.Fill(table);
  DevExpress.XtraCharts.Series series = new DevExpress.XtraCharts.Series();
  chartControl1.Series.Add(series);
  series.DataSource = table;
  series.ValueDataMembers.AddRange(new string[] { "SUM_O_Amount" });
  series.ArgumentScaleType = DevExpress.XtraCharts.ScaleType.Qualitative;
  series.ArgumentDataMember = "BillingState";
  series.ValueScaleType = DevExpress.XtraCharts.ScaleType.Numerical;
  chartControl1.Legend.Visibility = DevExpress.Utils.DefaultBoolean.False;
  ((DevExpress.XtraCharts.SideBySideBarSeriesView)series.View).ColorEach = true;
}
Data Connectors
ETL/ ELT Solutions
Cloud & API Connectivity
OEM & Custom Drivers