Discover how a bimodal integration strategy can address the major data management challenges facing your organization today.
Get the Report →How to create Visio diagrams from Redis Data
Automatically update Redis data with the changes you make to Visio master shapes.
Automate the process of entering data into Visio diagrams and keeping your diagrams up to date with the CData ODBC Driver for Redis. The driver surfaces Redis data as an ODBC data source that can be accessed by applications with built-in ODBC support like Microsoft Office. This article shows how to create a simple diagram to start brainstorming about Visio projects linked to Redis data.
Connect to Redis as an ODBC Data Source
If you have not already, first specify connection properties in an ODBC DSN (data source name). This is the last step of the driver installation. You can use the Microsoft ODBC Data Source Administrator to create and configure ODBC DSNs.
Set the following connection properties to connect to a Redis instance:
- Server: Set this to the name or address of the server your Redis instance is running on. You can specify the port in Port.
- Password: Set this to the password used to authenticate with a password-protected Redis instance , using the Redis AUTH command.
Set UseSSL to negotiate SSL/TLS encryption when you connect.
Connect Redis Data to Diagrams
Follow the steps below to use the Data Selector Wizard to import data into your diagram.
- Open Visio and click File -> New. Open the Brainstorming template.
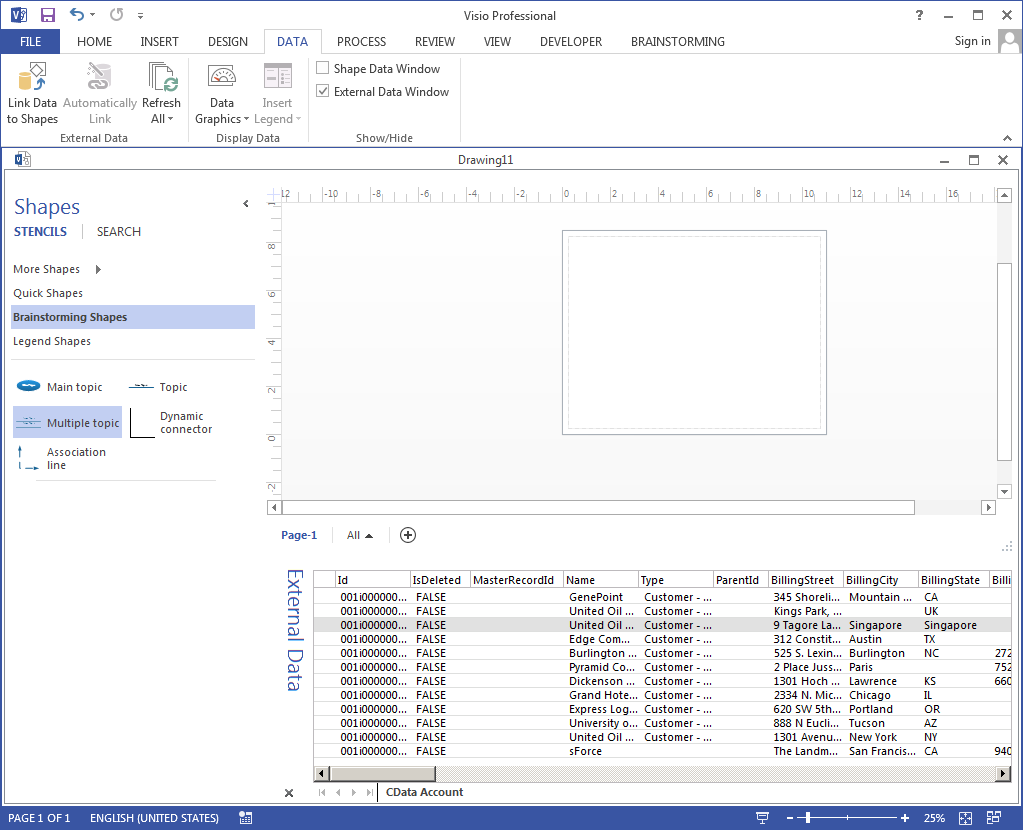
- On the Data tab, click Link Data to Shapes.
- Select the ODBC option and select ODBC DSN.
- Select the DSN for Redis, select the table you want to import, and finish the wizard. This article uses Customers as an example.
Link Redis Entities to Shapes
Follow the steps below to create a simple diagram that shows how to create shapes from your data, one of the ways to link Redis entities to shapes:
- Click Brainstorming Shapes and drag a main topic onto the drawing page. Enter Customers as the text of the main topic.
- Click Topic.
- Select a row in the External Data window and drag it onto the drawing page.
- Right-click the Topic shape and click Data -> Edit Data Graphic.
- Click New Item.
- In the Data Field menu, select a column. In the Displayed As menu, select how to display them.
![A data graphic for a column.]()
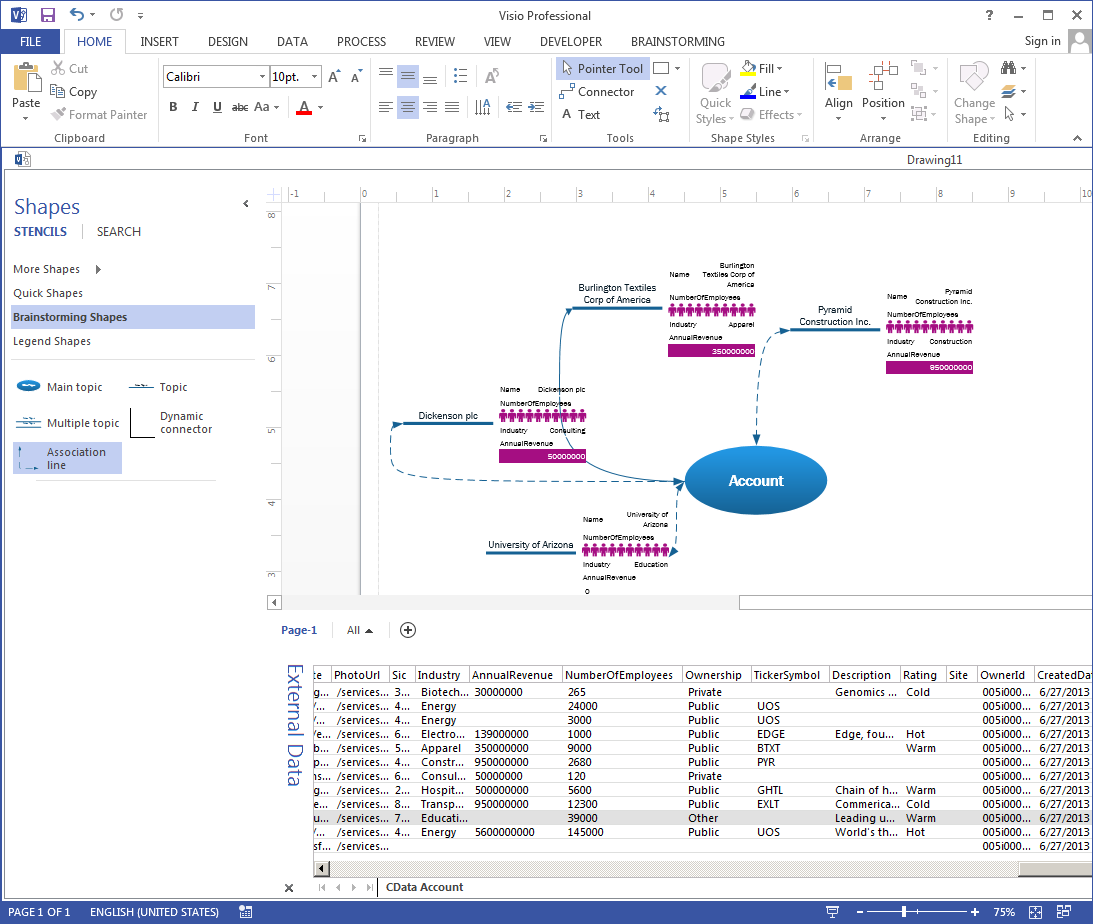
- Drag a few other Redis entities onto the drawing page and add association lines back to the main topic, Customers. New topics have the same configuration: Numeric columns displayed in data bars stand out in contrast to other Customers entities.
![Brainstorming with external data. (Salesforce is shown.)]()
You can refresh your diagram from the Data tab, synchronizing your shapes with the external Redis data.

