Discover how a bimodal integration strategy can address the major data management challenges facing your organization today.
Get the Report →Integrate REST Data in the Pentaho Report Designer
Publish reports based on REST data in the Pentaho BI tool.
The CData JDBC Driver for REST data enables access to live data from dashboards and reports. This article shows how to connect to REST data as a JDBC data source and publish reports based on REST data in Pentaho.
Connect and Create a Report
- Copy the JAR file of the driver, located in the lib subfolder of the installation directory, to the \Report-Designer\lib\jdbc\ folder in the Pentaho directory.
- Run the report-designer.bat file in the \Report-Designer\ folder to open the Report-Designer UI.
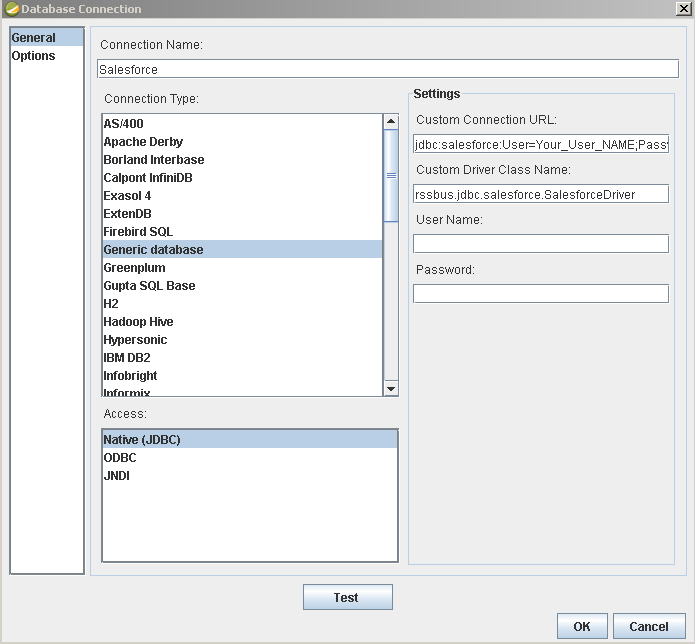
Create a new data source with the driver by clicking Data -> Add Data Source -> Advanced -> JDBC (Custom) and then creating a new REST connection. In the resulting dialog, configure the connection properties as shown below.
Custom Connection URL property: Enter the JDBC URL. This starts with jdbc:rest: and is followed by a semicolon-separated list of connection properties.
See the Getting Started chapter in the data provider documentation to authenticate to your data source: The data provider models REST APIs as bidirectional database tables and XML/JSON files as read-only views (local files, files stored on popular cloud services, and FTP servers). The major authentication schemes are supported, including HTTP Basic, Digest, NTLM, OAuth, and FTP. See the Getting Started chapter in the data provider documentation for authentication guides.
After setting the URI and providing any authentication values, set Format to "XML" or "JSON" and set DataModel to more closely match the data representation to the structure of your data.
The DataModel property is the controlling property over how your data is represented into tables and toggles the following basic configurations.
- Document (default): Model a top-level, document view of your REST data. The data provider returns nested elements as aggregates of data.
- FlattenedDocuments: Implicitly join nested documents and their parents into a single table.
- Relational: Return individual, related tables from hierarchical data. The tables contain a primary key and a foreign key that links to the parent document.
See the Modeling REST Data chapter for more information on configuring the relational representation. You will also find the sample data used in the following examples. The data includes entries for people, the cars they own, and various maintenance services performed on those cars.
Built-in Connection String Designer
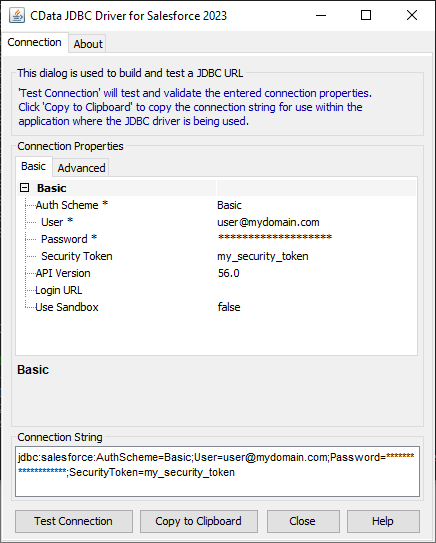
For assistance in constructing the JDBC URL, use the connection string designer built into the REST JDBC Driver. Either double-click the JAR file or execute the jar file from the command-line.
java -jar cdata.jdbc.rest.jarFill in the connection properties and copy the connection string to the clipboard.
![Using the built-in connection string designer to generate a JDBC URL (Salesforce is shown.)]()
When you configure the JDBC URL, you may also want to set the Max Rows connection property. This will limit the number of rows returned, which is especially helpful for improving performance when designing reports and visualizations.
Below is a typical JDBC URL:
jdbc:rest:DataModel=Relational;URI=C:/people.xml;Format=XML;- Custom Driver Class Name: Enter cdata.jdbc.rest.RESTDriver.
- User Name: The username to authenticate with.
- Password: The password to authenticate with.
![Required connection properties defined in the JDBC URL. (Salesforce is shown.)]()
Add REST Data to a Report
You are now ready to create a report with REST data.
-
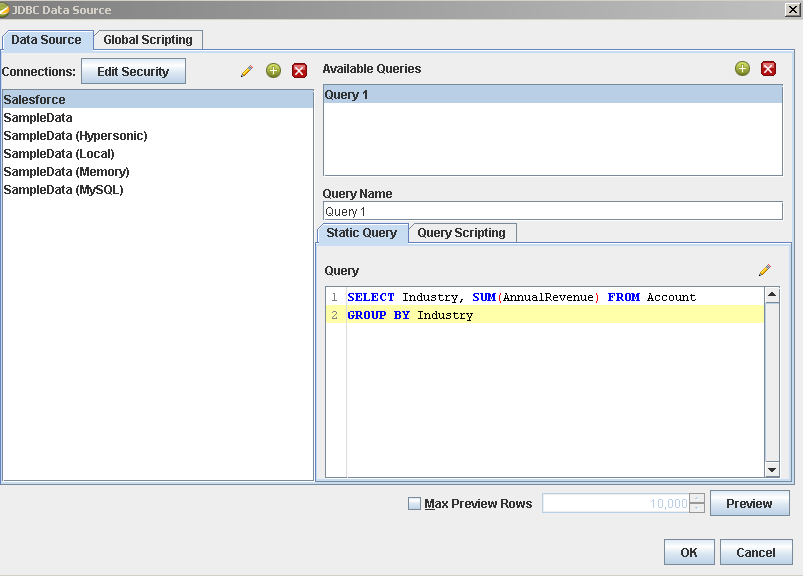
Add the REST source to your report: Click Data -> Add Data Source -> JDBC and select the data source.
Configure the query. This article uses the one below:
SELECT [people].[personal.age] AS age, [people].[personal.gender] AS gender, [people].[personal.name.first] AS first_name, [people].[personal.name.last] AS last_name, [vehicles].[model], FROM [people] JOIN [vehicles] ON [people].[_id] = [vehicles].[people_id]![The query to retrieve data, specified in the JDBC data source configuration wizard. (Salesforce is shown.)]()
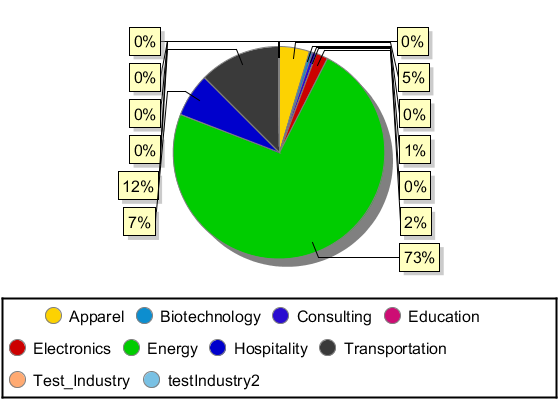
- Drag a chart onto your report and double-click it to edit the chart. Run the report to display the chart. You can use the results of this query to create a simple chart for the people table.
- Finally, run the report to see the chart.
