Discover how a bimodal integration strategy can address the major data management challenges facing your organization today.
Get the Report →Connect to SAP SuccessFactors Data in Jaspersoft Studio
Execute SQL to remote SAP SuccessFactors data in Jaspersoft Studio.
This article shows how to connect to SAP SuccessFactors from Jaspersoft Studio as a standard JDBC data source with the CData JDBC Driver for SAP SuccessFactors. You will use the standard Jaspersoft wizards to build SQL queries to SAP SuccessFactors. The queries are executed directly to the SAP SuccessFactors APIs, enabling real-time connectivity to SAP SuccessFactors data.
Connect to SAP SuccessFactors Data as a JDBC Data Source
To create a JDBC data source in Jaspersoft Studio, create a data adapter:
- In the Repository Explorer view, right-click the Data Adapters node and click Create Data Adapter.
- Select Database JDBC Connection.
- Enter a user-friendly name for the driver.
- On the Driver Classpath tab, click Add. In the resulting dialog, navigate to the lib subfolder of the installation directory. Select the driver JAR.
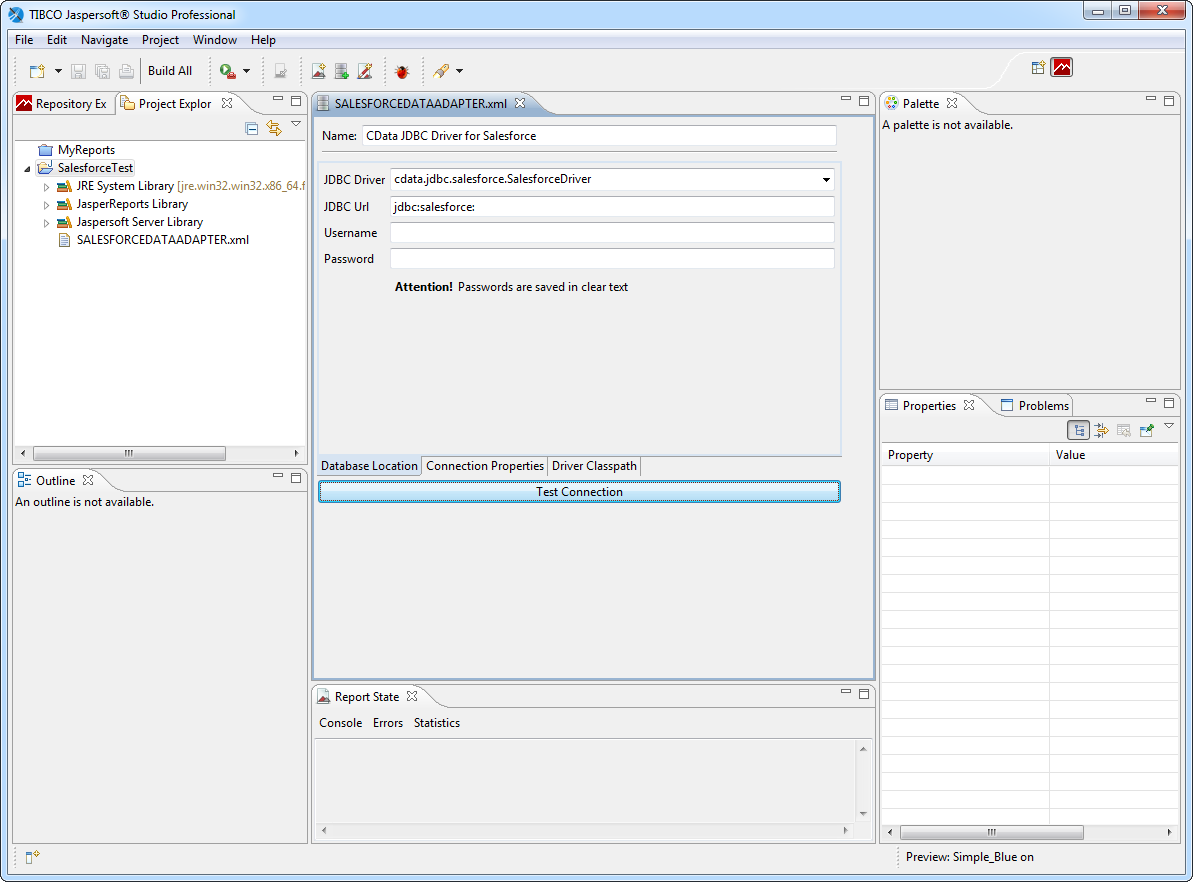
- On the Database Location tab, enter the class name of the JDBC driver: cdata.jdbc.sapsuccessfactors.SAPSuccessFactorsDriver.
- Enter the JDBC URL.
You can authenticate to SAP Success Factors using Basic authentication or OAuth with SAML assertion.
Basic Authentication
You must provide values for the following properties to successfully authenticate to SAP Success Factors. Note that the provider will reuse the session opened by SAP Success Factors using cookies. Which means that your credentials will be used only on the first request to open the session. After that, cookies returned from SAP Success Factors will be used for authentication.
- Url: set this to the URL of the server hosting Success Factors. Some of the servers are listed in the SAP support documentation (external link).
- User: set this to the username of your account.
- Password: set this to the password of your account.
- CompanyId: set this to the unique identifier of your company.
OAuth Authentication
You must provide values for the following properties, which will be used to get the access token.
- Url: set this to the URL of the server hosting Success Factors. Some of the servers are listed in the SAP support documentation (external link).
- User: set this to the username of your account.
- CompanyId: set this to the unique identifier of your company.
- OAuthClientId: set this to the API Key that was generated in API Center.
- OAuthClientSecret: the X.509 private key used to sign SAML assertion. The private key can be found in the certificate you downloaded in Registering your OAuth Client Application.
- InitiateOAuth: set this to GETANDREFRESH.
Built-in Connection String Designer
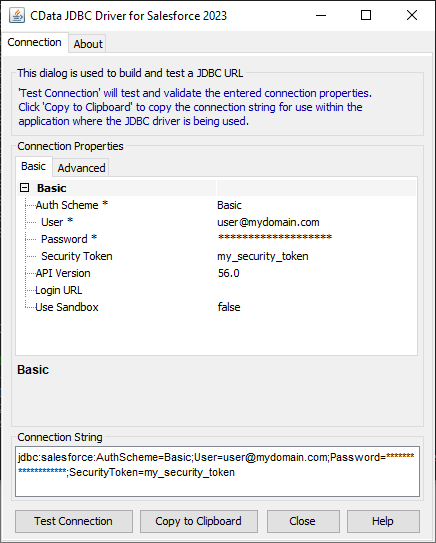
For assistance in constructing the JDBC URL, use the connection string designer built into the SAP SuccessFactors JDBC Driver. Either double-click the JAR file or execute the jar file from the command-line.
java -jar cdata.jdbc.sapsuccessfactors.jarFill in the connection properties and copy the connection string to the clipboard.
![Using the built-in connection string designer to generate a JDBC URL (Salesforce is shown.)]()
When you configure the JDBC URL, you may also want to set the Max Rows connection property. This will limit the number of rows returned, which is especially helpful for improving performance when designing reports and visualizations.
Below is a typical JDBC URL for SAP SuccessFactors:
jdbc:sapsuccessfactors:User=username;Password=password;CompanyId=CompanyId;Url=https://api4.successfactors.com;![A data adapter configured to use the JDBC Driver. (Salesforce is shown.)]()
Create Reports with SAP SuccessFactors Data
Follow the steps below to build an SQL query to SAP SuccessFactors, the basis of a simple report:
- Click File -> New Jasper Report. Select a template, select the parent project, and specify the report file.
- In the Data Adapter menu, select the data adapter you created in the previous section.
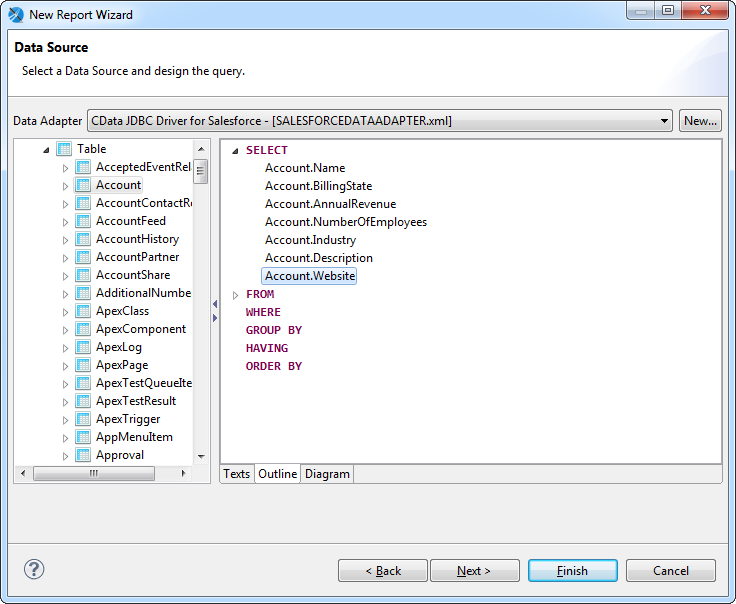
- In the Diagram tab, drag tables into the box and click the columns you want. Or, enter a custom query on the Texts tab. For example:
SELECT address1, zipCode FROM ExtAddressInfo WHERE city = 'Springfield'![The SQL query to be used to pull data into the report. (Salesforce is shown.)]()
- Select the fields you want to include in the dataset. This example uses all fields.
- Skip the Group By step and finish the wizard.
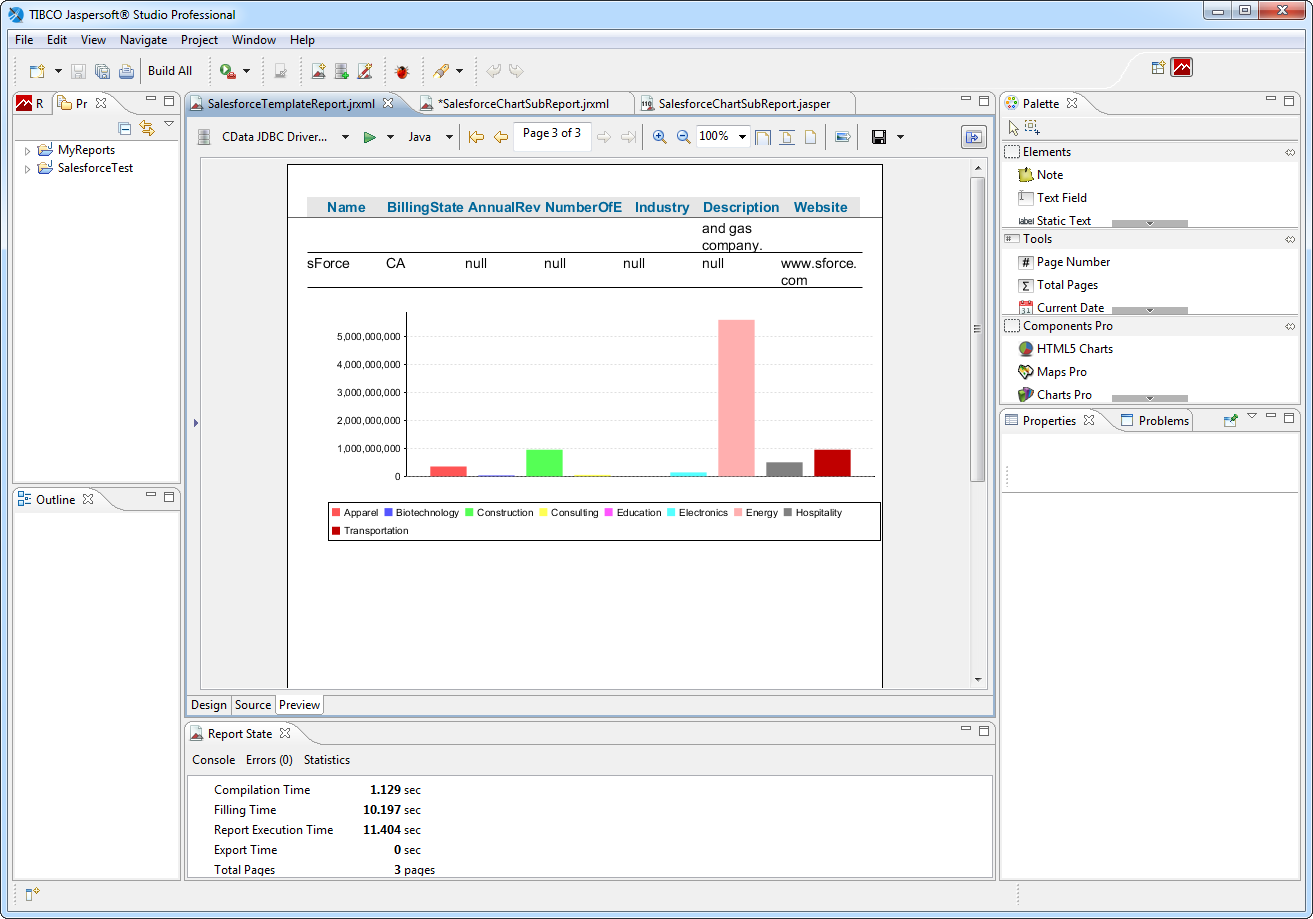
In the Preview tab, you can see the report as it would look with the current SAP SuccessFactors data.
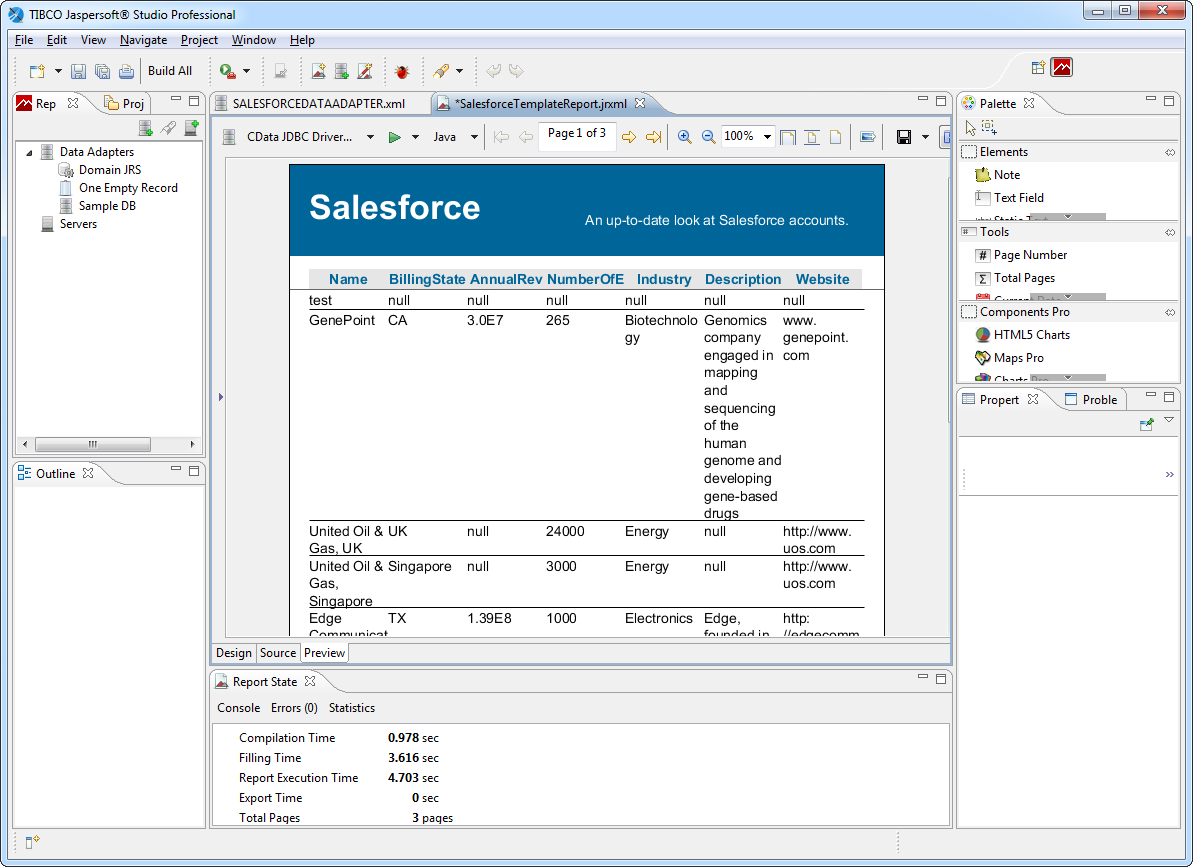
Create a Chart
The following sections show how to create a chart tied to its own SQL query. When retrieving the data from the remote data source, more restrictive queries, written for specific report objects, can result in faster performance.
Create a DataSet
Follow the steps below to create a new dataset to populate the chart:
- In the report editing area, click the Design tab.
- In the Outline view, right-click the root node for the report and click Create Dataset.
- Enter a name for the dataset and click the option to create a new dataset from a connection or data source.
- In the Data Adapter menu, select the data adapter you created in the first section.
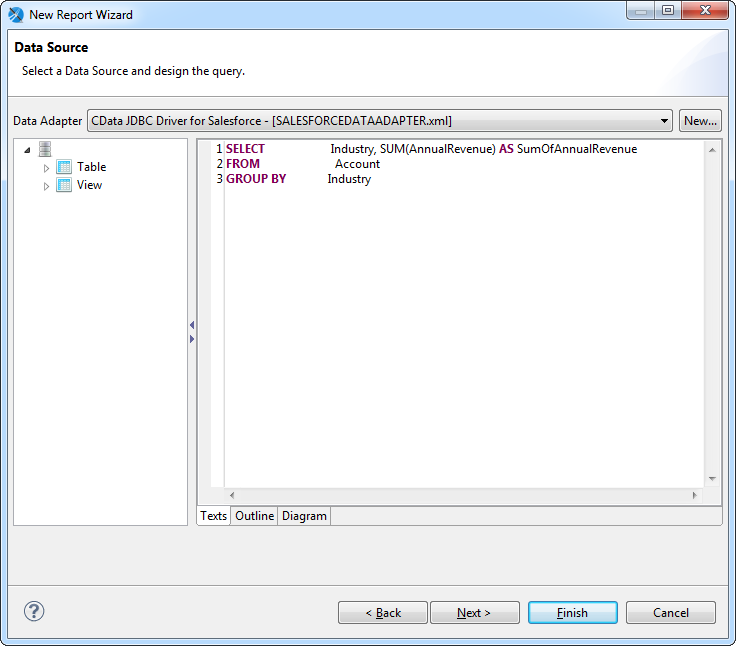
- Enter a query such as the following:
SELECT address1, zipCode FROM ExtAddressInfo WHERE city = 'Springfield'![The SQL query to be used to fill the chart. (Salesforce is shown.)]()
- Select the fields you want in the dataset. This example uses address1 and zipCode.
- Skip the step to group by fields and finish the wizard.
Configure the Chart
After adding the dataset, follow the steps below to map column values to the chart axes in the chart wizard:
- Click the Summary node in the Outline view. In the Properties view, set the height to 400 pixels. The summary band is printed at the end of the report.
- Drag a chart from the Palette onto the summary. The chart wizard is displayed.
- Select the chart type. This example uses a bar chart.
- In the Dataset menu, select the dataset you created for the chart.
- In the Dataset tab, select the option to use the same JDBC connection used to fill the master report.
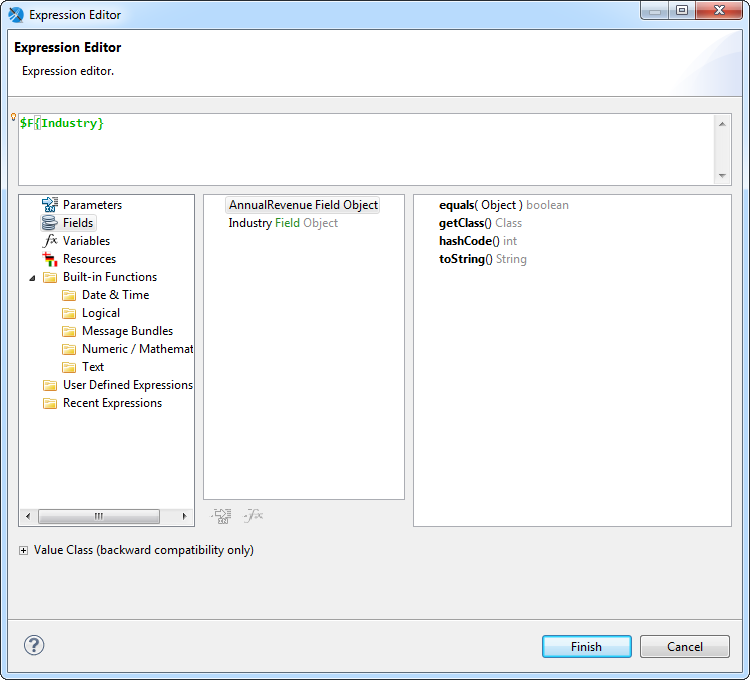
- Specify the chart's series: Click the button next to the Series menu and click Add. In the Expression Editor that is displayed, double-click the address1 column to set the expression to $F{address1}.
![The column selected as the Series for the chart.]()
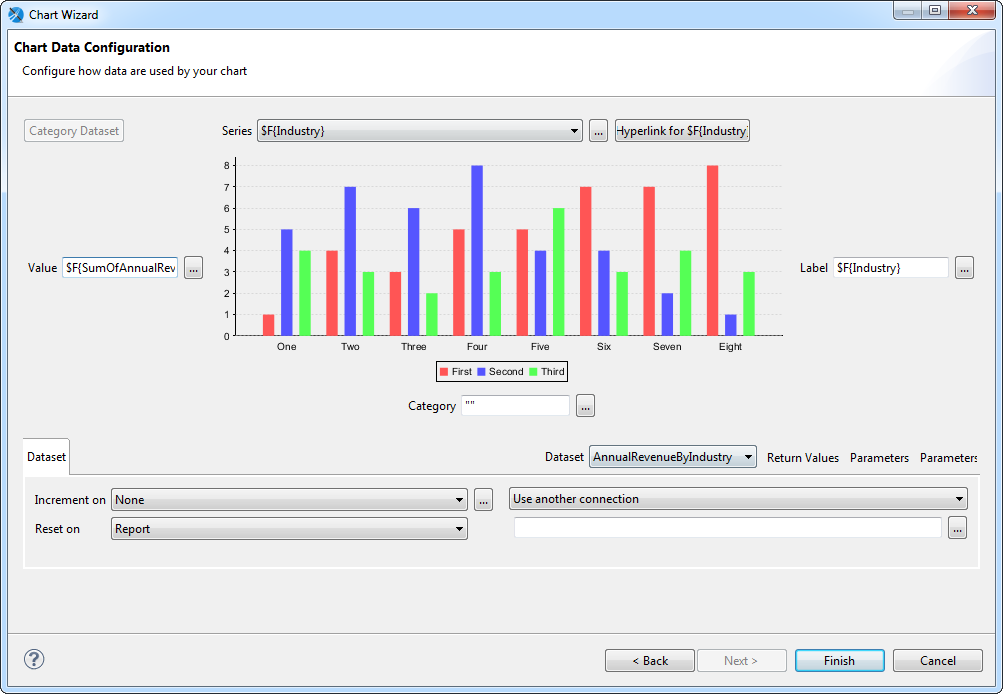
Specify the y-axis values: In the chart wizard, click the button next to the Value box. In the Expression Editor, double-click zipCode to set the expression to $F{zipCode}.
- Specify the labels for the series elements: In the chart wizard, click the button next to the Label box. In the Expression Editor, double-click the address1 column to set the expression to $F{address1}. If needed, convert the column type to string, as in the following expression:
$F{address1}.toString()![Columns selected for the axes of the chart.]()
- Expand the chart to fill the summary section: right-click the chart and click Size to Container -> Fit Both.
Running the Report
You can now generate reports on SAP SuccessFactors data just as you would any other JDBC data source. Jaspersoft Studio periodically refreshes the data across report runs.
