製品をチェック

無償トライアル:

無償トライアルへ

製品の情報と無償トライアルへ:

ADP ADO.NET Provider

ADP 連携のパワフルな.NET アプリケーションを素早く作成して配布。

データ連携でお困りですか?

お問い合わせ

Visual Studio でチャートコントロールと ADP をデータバインド


標準ADO.NET プロシージャを使ってデータバインドして、Visual Studio ツールボックスのコントロールから ADP との双方向接続を実現。この記事ではVisual Studio のグラフィカルアプローチと、ほんの数行のコードでデータバインドをする方法を説明します。


adp ロゴ画像
ado ロゴ画像

ADO.NET

.NET ロゴ画像

データバインドによって、UI コントロールからデータに接続できます。 CData ADO.NET Provider for ADP を使って、Visual Studio 上でWindows Forms およびWeb Forms とADP をデータバインドできます。この記事で、ADP を、ウィザードから変更をリアルタイムで反映するチャートにデータバインドする方法を説明します。 Code Walk-through セクションではチャートはほんの10行のコードで作成します。
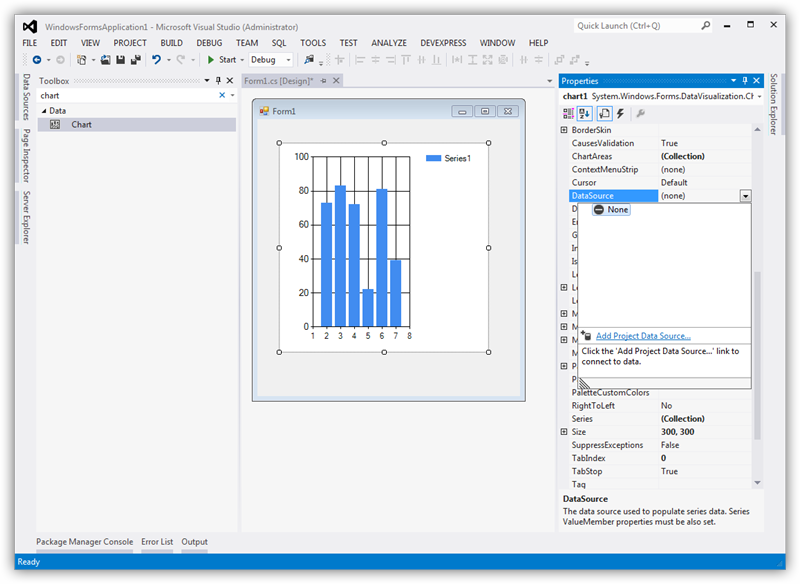
チャートへのデータバインド

データバインドは3つのステップから構成されます;コントロールのインスタンス作成、データソースの設定、データバインドです。

接続を設定してデータベースオブジェクトを選択

下の手続きにより、データソース構成ウィザードを使ってチャートコントロールとADP との接続を作成します。ウィザード上でデータバインドをするADP エンティティを使います。

  1. Windows Forms プロジェクトでは、チャートコントロールをツールボックスからフォーム上にドラグ&ドロップします。チャートプロパティのデータセクションで DataSource を選択し、メニューからプロジェクトデータソースの追加を選択します。 Add a data source to be bound to the chart.
  2. 出てくるデータソース構成ウィザードでデータベース -> データセットを選択します。
  3. データ接続ステップで、「新しい接続」をクリックします。
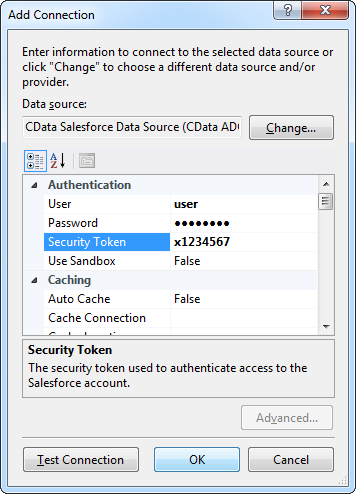
  4. データ接続の選択ダイアログで、「変更」をクリックして、CData ADP データソースを選択して、接続プロパティを入力します。下は代表的な接続文字列ですです。:

    OAuthClientId=YourClientId;OAuthClientSecret=YourClientSecret;SSLClientCert='c:\cert.pfx';SSLClientCertPassword='admin@123'

    Connect to ADP by specifying the following properties:

    • SSLClientCert: Set this to the certificate provided during registration.
    • SSLClientCertPassword: Set this to the password of the certificate.
    • UseUAT: The connector makes requests to the production environment by default. If using a developer account, set UseUAT = true.
    • RowScanDepth: The maximum number of rows to scan for the custom fields columns available in the table. The default value will be set to 100. Setting a high value may decrease performance.

    The connector uses OAuth to authenticate with ADP. OAuth requires the authenticating user to interact with ADP using the browser. For more information, refer to the OAuth section in the Help documentation.

  5. Connection properties for the selected data source in the Add Connection dialog. (Salesforce is shown.)
  6. 使用するデータソースオブジェクトを選択します。例は Workers テーブルです。 Select database objects. (Salesforce is shown.)

DataBind

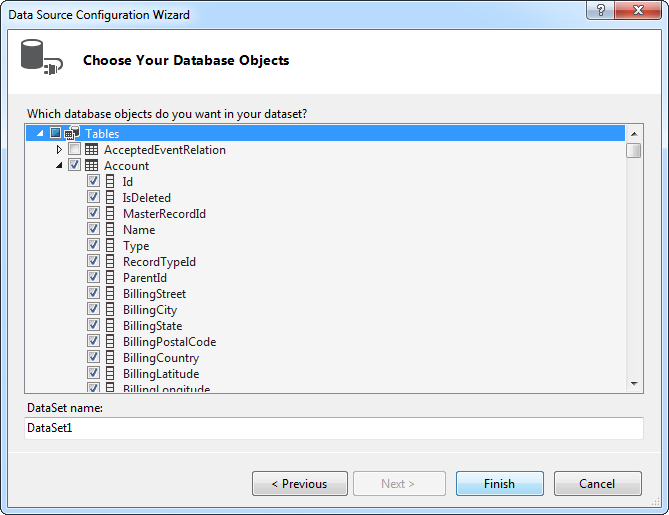
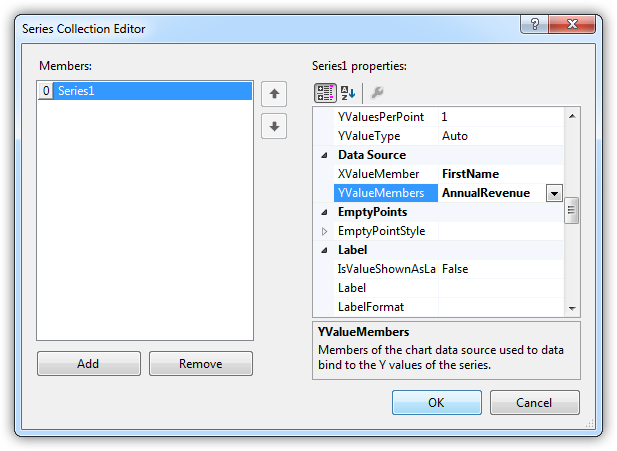
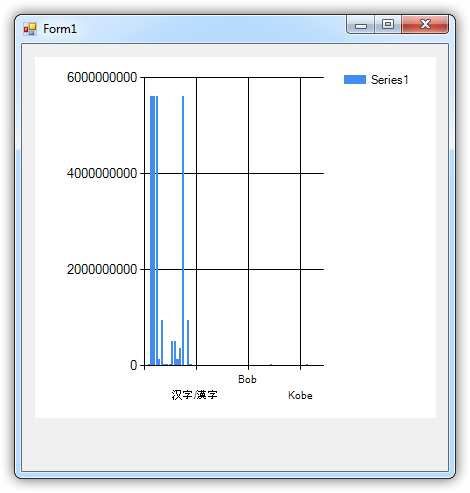
データソースの追加とデータベースオブジェクトを選択したら、チャートにオブジェクトをバインドします。この例では、X軸に AssociateOID をY軸に WorkerID を設定します。

  1. チャートプロパティで、Series プロパティをクリックし、Series コレクション エディター を開きます。
  2. Series プロパティでX軸、Y軸に設定するカラムを選択します:XValueMember および YValueMember プロパティにメニューからカラムを選びます。
The axes of the chart defined in the Series Collection Editor.

チャートはこれでADP にデータバインドされました。チャートを実行して最新のデータを表示させましょう。 The chart, filled with data at run time.

コード Walk-through

ADP へのデータバインドはほんの数行のコードのみが必要で、3つの簡単なステップで完了できます。

  1. ADP に接続します。
  2. ADPDataAdapter を作成して、クエリを作成し、結果を入れるデータセットを作成します。
  3. 結果セットとチャートをデータバインドします。

下に完全なコードを示します:

ADPConnection conn = new ADPConnection("OAuthClientId=YourClientId;OAuthClientSecret=YourClientSecret;SSLClientCert='c:\cert.pfx';SSLClientCertPassword='admin@123'"); ADPCommand comm = new ADPCommand("SELECT AssociateOID, WorkerID FROM Workers WHERE AssociateOID = 'G3349PZGBADQY8H8'", conn); ADPDataAdapter da = new ADPDataAdapter(comm); DataSet dataset = new DataSet(); da.Fill(dataset); chart1.DataSource = dataset; chart1.Series[0].XValueMember = "AssociateOID"; chart1.Series[0].YValueMembers = "WorkerID"; // Insert code for additional chart formatting here. chart1.DataBind();