ノーコードでクラウド上のデータとの連携を実現。
詳細はこちら →ADP ODBC Driver の30日間無償トライアルをダウンロード
30日間の無償トライアルへ製品の詳細
ADP ODBC Driver は、ODBC 接続をサポートするあらゆるツールからのシームレスなADP データ連携を実現します。
使い慣れたODBC インターフェースで、自由自在にADP データの読み、書き、更新を実行できます。
こんにちは!ドライバー周りのヘルプドキュメントを担当している古川です。
Excel に組み込まれているODBC サポートを使用して、ADP データを使用したPower View レポートを素早く作成できます。この記事では、Data リボンからアクセスできるData Connection Wizard を使用して、ADP をPower View レポートにインポートする方法を説明します。
CData ODBC ドライバは、以下のような特徴を持ったリアルタイムデータ連携ソリューションです。
CData ODBC ドライバでは、1.データソースとしてADP の接続を設定、2.Power View 側でODBC Driver との接続を設定、という2つのステップだけでデータソースに接続できます。以下に具体的な設定手順を説明します。
まずは、本記事右側のサイドバーからADP ODBC Driver の無償トライアルをダウンロード・インストールしてください。30日間無償で、製品版の全機能が使用できます。
未指定の場合は、初めにODBC DSN で接続プロパティを指定します。ドライバーのインストールの最後にアドミニストレーターが開きます。Microsoft ODBC Data Source Administrator を使用して、ODBC DSN を作成および構成できます。
接続を確立する前に、ADP に連絡してOAuth アプリとそれに関連するクレデンシャルを提供してもらう必要があります。 これらのクレデンシャルはADP からのみ取得が可能で、直接取得することはできません。
次のプロパティを指定してADP に接続します。
DSN を構成する際に、Max Rows プロパティを定めることも可能です。これによって返される行数が制限されるので、ビジュアライゼーション・レポートのデザイン時のパフォーマンスを向上させるのに役立ちます。
以下のステップに従って、Excel のData Connection Wizard からDSN に接続します。
操作するテーブルを選択します。
複数のテーブルをインポートする場合は、[Connect to a specific table]オプションの選択を解除します。データソースに接続したら、複数のテーブルを選択できます。[Finish]をクリックして[Data Connection Wizard]を閉じた後、[Select Table]ダイアログで[Enable selection of multiple tables]オプションを選択します。
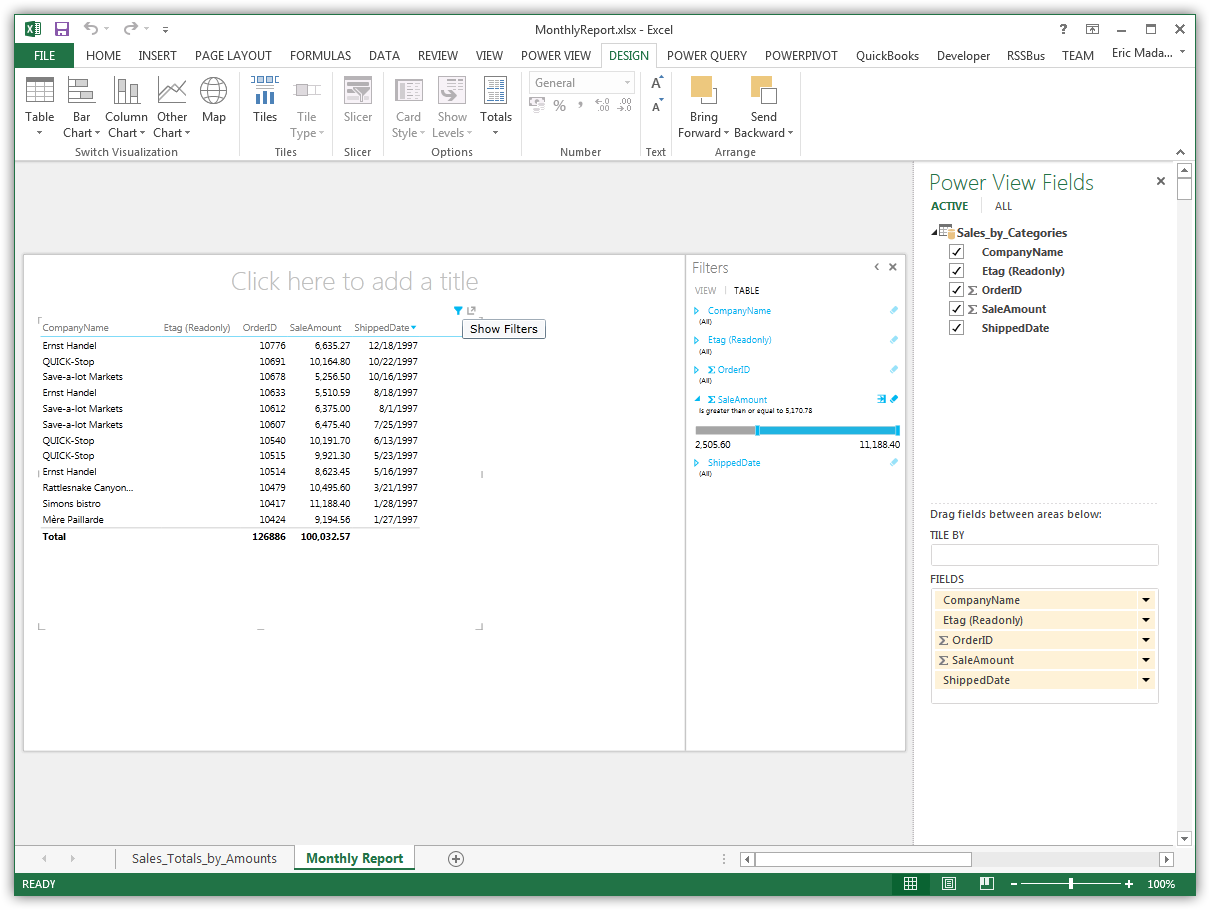
テーブルは、チャートやその他のデータの表現の開始点です。テーブルを作成するには、フィールドリストでカラムを選択します。テーブル名とカラム名をビューにドラッグアンドドロップすることも可能です。
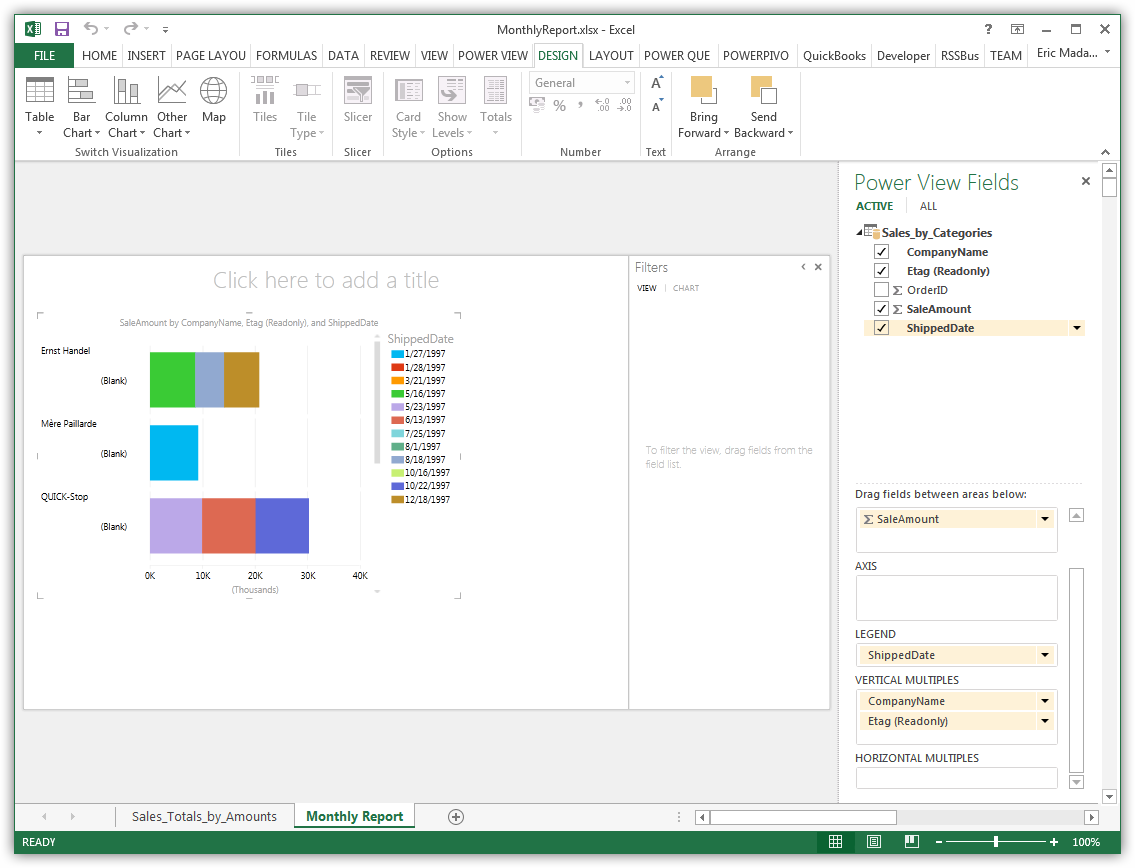
[Design]タブで、テーブルをチャートやその他のビジュアライゼーションに変更できます。
このようにCData ODBC ドライバと併用することで、270を超えるSaaS、NoSQL データをコーディングなしで扱うことができます。30日の無償評価版が利用できますので、ぜひ自社で使っているクラウドサービスやNoSQL と合わせて活用してみてください。
CData ODBC ドライバは日本のユーザー向けに、UI の日本語化、ドキュメントの日本語化、日本語でのテクニカルサポートを提供しています。