ノーコードでクラウド上のデータとの連携を実現。
詳細はこちら →Google Search Data Provider の30日間無償トライアルをダウンロード
30日間の無償トライアルへCData


こんにちは!ウェブ担当の加藤です。マーケ関連のデータ分析や整備もやっています。
Google Search 用の CData ADO.NET プロバイダーはサードパーティーコントロールで使うことのできる通常のADO.NET データベースアクセスコンポーネントを実装しています。データバインドするための通常のADO.NET プロセスに従うことで、UI コントロールから実データへの双方向アクセスを可能にします。 この記事では、CData を使ってDevExpress Windows Forms とウェブコントロールにデータバインドする方法を説明します。ここでは、最新のデータを表示するチャートにデータバインドします。
Google カスタム検索エンジンを使って検索するには、CustomSearchId およびAPIKey 接続プロパティが必要です。
CustomSearchId を取得するには、Google カスタム検索エンジンにサインインして検索エンジンを新規作成します。
APIKey を取得するには、Google API Console でカスタム検索API を有効にします。
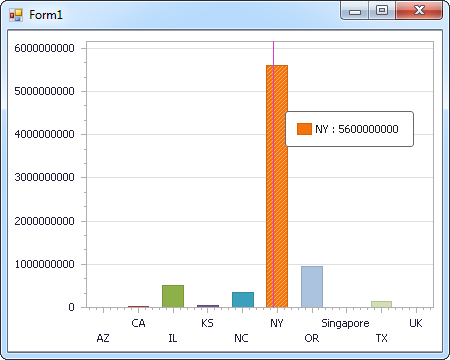
下のコードでは、Google Search でDevExpress のチャートに追加する方法を説明します。GoogleSearchDataAdapter はチャートコントロールのSeries プロパティにバインドします。コントロールのDiagram プロパティはx 軸とy 軸をカラム名として定義します。
using (GoogleSearchConnection connection = new GoogleSearchConnection(
"CustomSearchId=def456;ApiKey=abc123;")) {
  GoogleSearchDataAdapter dataAdapter = new GoogleSearchDataAdapter(
  "SELECT Title, ViewCount FROM VideoSearch WHERE SearchTerms = 'WayneTech'", connection);

  DataTable table = new DataTable();
  dataAdapter.Fill(table);
  DevExpress.XtraCharts.Series series = new DevExpress.XtraCharts.Series();
  chartControl1.Series.Add(series);
  DataTable table = new DataTable();
  series.ValueDataMembers.AddRange(new string[] { "ViewCount" });
  series.ArgumentScaleType = DevExpress.XtraCharts.ScaleType.Qualitative;
  series.ArgumentDataMember = "Title";
  series.ValueScaleType = DevExpress.XtraCharts.ScaleType.Numerical;
  chartControl1.Legend.Visibility = DevExpress.Utils.DefaultBoolean.False;
  ((DevExpress.XtraCharts.SideBySideBarSeriesView)series.View).ColorEach = true;
}
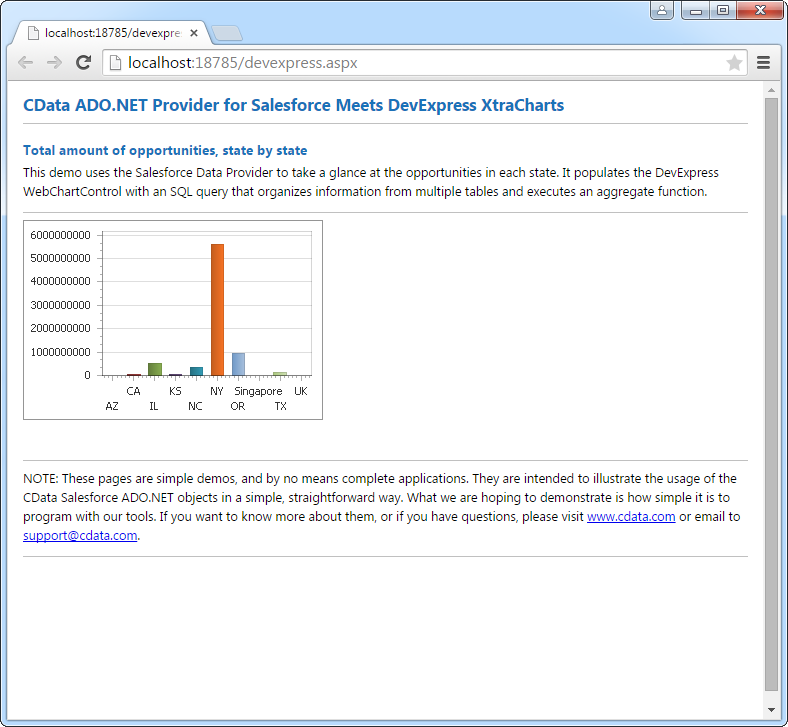
下のコードではGoogle Search でDevExpress Web を操作するための設定方法を説明します。GoogleSearchDataAdapter はチャートのSeries プロパティにバインドします。Diagram プロパティはx 軸とy 軸をカラム名として定義します。
using DevExpress.XtraCharts;

using (GoogleSearchConnection connection = new GoogleSearchConnection(
"CustomSearchId=def456;ApiKey=abc123;"))
{
  GoogleSearchDataAdapter GoogleSearchDataAdapter1 = new GoogleSearchDataAdapter("SELECT Title, ViewCount FROM VideoSearch WHERE SearchTerms = 'WayneTech'", connection);
  DataTable table = new DataTable();
  GoogleSearchDataAdapter1.Fill(table);
  DevExpress.XtraCharts.Series series = new Series("Series1", ViewType.Bar);
  WebChartControl1.Series.Add(series);
  DataTable table = new DataTable();
  series.ValueDataMembers.AddRange(new string[] { "ViewCount" });
  series.ArgumentScaleType = ScaleType.Qualitative;
  series.ArgumentDataMember = "Title";
  series.ValueScaleType = ScaleType.Numerical;
  ((DevExpress.XtraCharts.SideBySideBarSeriesView)series.View).ColorEach = true;
}