ノーコードでクラウド上のデータとの連携を実現。
詳細はこちら →Adobe Commerce Data Provider の30日間無償トライアルをダウンロード
30日間の無償トライアルへCData


こんにちは!ウェブ担当の加藤です。マーケ関連のデータ分析や整備もやっています。
Adobe Commerce 用の CData ADO.NET プロバイダーはサードパーティーコントロールで使うことのできる通常のADO.NET データベースアクセスコンポーネントを実装しています。データバインドするための通常のADO.NET プロセスに従うことで、UI コントロールから実データへの双方向アクセスを可能にします。 この記事では、CData を使ってDevExpress Windows Forms とウェブコントロールにデータバインドする方法を説明します。ここでは、最新のデータを表示するチャートにデータバインドします。
Adobe Commerce はOAuth 1 認証標準を使用します。Adobe Commerce REST API に接続するには、Adobe Commerce システムにアプリを登録してOAuthClientId、OAuthClientSecret、およびCallbackURL 接続プロパティの値を取得する必要があります。 OAuth 値を取得して接続するには、ヘルプドキュメントの「はじめに」を参照してください。
また、Adobe Commerce システムへのURL を提供する必要があります。URL は、Adobe Commerce REST API を顧客として使用しているか管理者として使用しているかによって異なります。
Customer: Adobe Commerce を顧客として使用するには、事前にAdobe Commerce のホームページで顧客アカウントを作成します。これを行うには、「アカウント」->「登録」をクリックします。それからURL 接続プロパティをAdobe Commerce システムのエンドポイントに設定します。
Administrator: Adobe Commerce を管理者として使用するには、代わりにCustomAdminPath を設定します。この値は、「Admin」メニューの「Advanced」設定で取得できます。「System」->「Configuration」->「Advanced」->「Admin」->「Admin Base URL」を選択することでアクセスできます。
このページ上の「Use Custom Admin Path」設定がYES に設定されている場合、値は「Custom Admin Path」テキストボックス内にあります。それ以外の場合は、CustomAdminPath 接続プロパティをデフォルト値の"admin" に設定します。
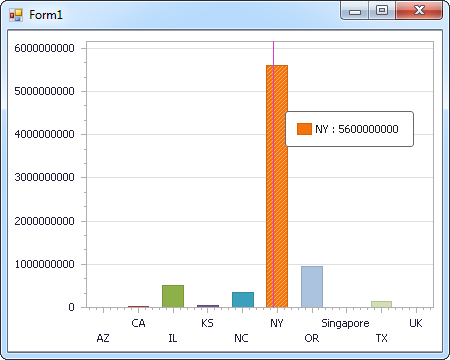
下のコードでは、Adobe Commerce でDevExpress のチャートに追加する方法を説明します。AdobeCommerceDataAdapter はチャートコントロールのSeries プロパティにバインドします。コントロールのDiagram プロパティはx 軸とy 軸をカラム名として定義します。
using (AdobeCommerceConnection connection = new AdobeCommerceConnection(
"OAuthClientId=MyConsumerKey;OAuthClientSecret=MyConsumerSecret;CallbackURL=http://127.0.0.1:33333;Url=https://myadobecommercehost.com;")) {
  AdobeCommerceDataAdapter dataAdapter = new AdobeCommerceDataAdapter(
  "SELECT Name, Price FROM Products", connection);

  DataTable table = new DataTable();
  dataAdapter.Fill(table);
  DevExpress.XtraCharts.Series series = new DevExpress.XtraCharts.Series();
  chartControl1.Series.Add(series);
  DataTable table = new DataTable();
  series.ValueDataMembers.AddRange(new string[] { "Price" });
  series.ArgumentScaleType = DevExpress.XtraCharts.ScaleType.Qualitative;
  series.ArgumentDataMember = "Name";
  series.ValueScaleType = DevExpress.XtraCharts.ScaleType.Numerical;
  chartControl1.Legend.Visibility = DevExpress.Utils.DefaultBoolean.False;
  ((DevExpress.XtraCharts.SideBySideBarSeriesView)series.View).ColorEach = true;
}
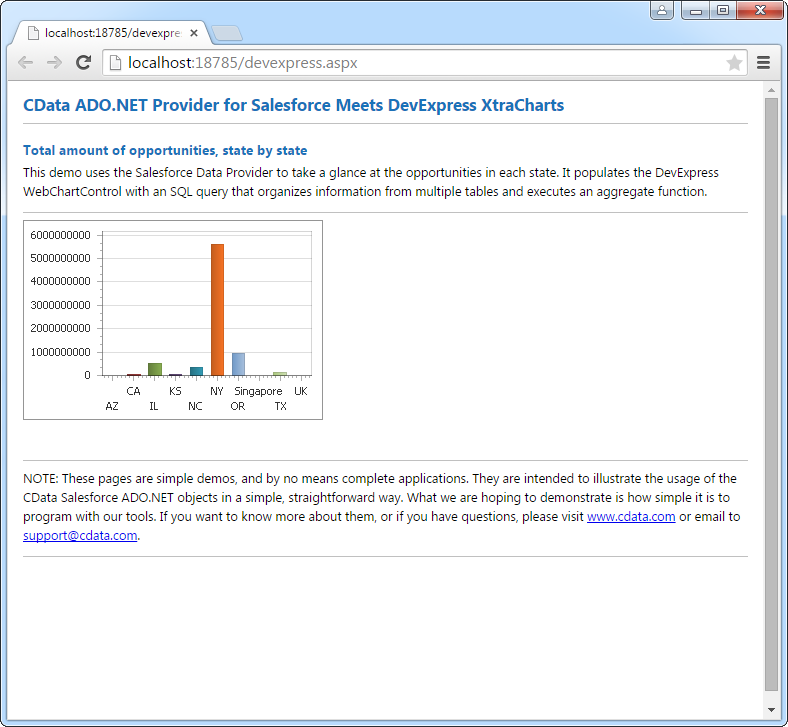
下のコードではAdobe Commerce でDevExpress Web を操作するための設定方法を説明します。AdobeCommerceDataAdapter はチャートのSeries プロパティにバインドします。Diagram プロパティはx 軸とy 軸をカラム名として定義します。
using DevExpress.XtraCharts;

using (AdobeCommerceConnection connection = new AdobeCommerceConnection(
"OAuthClientId=MyConsumerKey;OAuthClientSecret=MyConsumerSecret;CallbackURL=http://127.0.0.1:33333;Url=https://myadobecommercehost.com;"))
{
  AdobeCommerceDataAdapter AdobeCommerceDataAdapter1 = new AdobeCommerceDataAdapter("SELECT Name, Price FROM Products", connection);
  DataTable table = new DataTable();
  AdobeCommerceDataAdapter1.Fill(table);
  DevExpress.XtraCharts.Series series = new Series("Series1", ViewType.Bar);
  WebChartControl1.Series.Add(series);
  DataTable table = new DataTable();
  series.ValueDataMembers.AddRange(new string[] { "Price" });
  series.ArgumentScaleType = ScaleType.Qualitative;
  series.ArgumentDataMember = "Name";
  series.ValueScaleType = ScaleType.Numerical;
  ((DevExpress.XtraCharts.SideBySideBarSeriesView)series.View).ColorEach = true;
}