ノーコードでクラウド上のデータとの連携を実現。
詳細はこちら →Shopify Data Provider の30日間無償トライアルをダウンロード
30日間の無償トライアルへCData


こんにちは!ウェブ担当の加藤です。マーケ関連のデータ分析や整備もやっています。
Shopify 用の CData ADO.NET プロバイダーはサードパーティーコントロールで使うことのできる通常のADO.NET データベースアクセスコンポーネントを実装しています。データバインドするための通常のADO.NET プロセスに従うことで、UI コントロールから実データへの双方向アクセスを可能にします。 この記事では、CData を使ってDevExpress Windows Forms とウェブコントロールにデータバインドする方法を説明します。ここでは、最新のデータを表示するチャートにデータバインドします。
CData 製品のすべての機能を利用するには、AppId、Password、およびShopUrl 接続プロパティを指定します。
これらの値を取得するには、Shopify への接続 を参照して、CData 製品をアプリケーションとしてShopify に登録します。
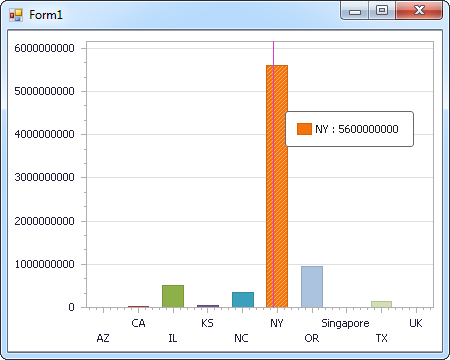
下のコードでは、Shopify でDevExpress のチャートに追加する方法を説明します。ShopifyDataAdapter はチャートコントロールのSeries プロパティにバインドします。コントロールのDiagram プロパティはx 軸とy 軸をカラム名として定義します。
using (ShopifyConnection connection = new ShopifyConnection(
"AppId=MyAppId;Password=MyPassword;ShopUrl=https://yourshopname.myshopify.com;")) {
  ShopifyDataAdapter dataAdapter = new ShopifyDataAdapter(
  "SELECT FirstName, Id FROM Customers", connection);

  DataTable table = new DataTable();
  dataAdapter.Fill(table);
  DevExpress.XtraCharts.Series series = new DevExpress.XtraCharts.Series();
  chartControl1.Series.Add(series);
  DataTable table = new DataTable();
  series.ValueDataMembers.AddRange(new string[] { "Id" });
  series.ArgumentScaleType = DevExpress.XtraCharts.ScaleType.Qualitative;
  series.ArgumentDataMember = "FirstName";
  series.ValueScaleType = DevExpress.XtraCharts.ScaleType.Numerical;
  chartControl1.Legend.Visibility = DevExpress.Utils.DefaultBoolean.False;
  ((DevExpress.XtraCharts.SideBySideBarSeriesView)series.View).ColorEach = true;
}
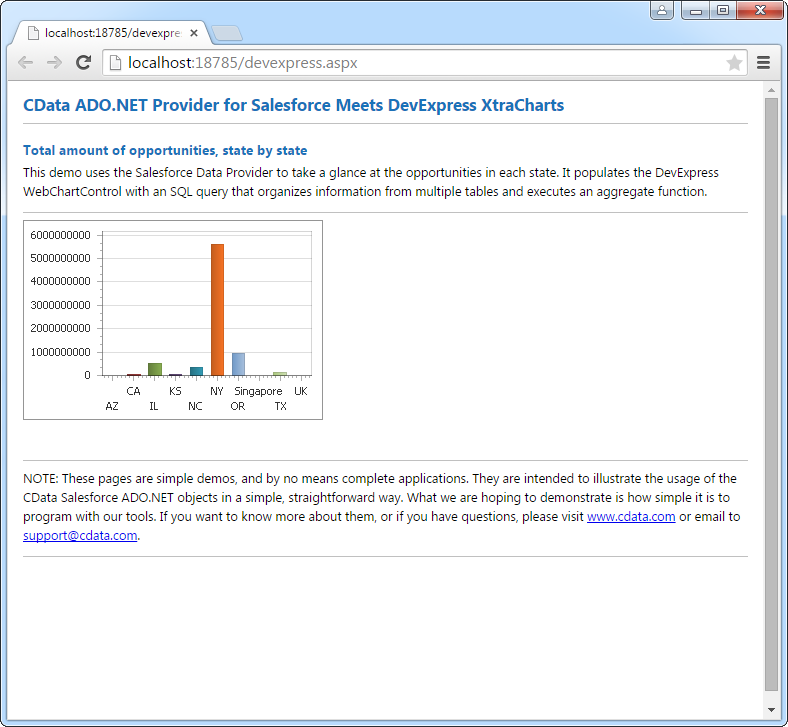
下のコードではShopify でDevExpress Web を操作するための設定方法を説明します。ShopifyDataAdapter はチャートのSeries プロパティにバインドします。Diagram プロパティはx 軸とy 軸をカラム名として定義します。
using DevExpress.XtraCharts;

using (ShopifyConnection connection = new ShopifyConnection(
"AppId=MyAppId;Password=MyPassword;ShopUrl=https://yourshopname.myshopify.com;"))
{
  ShopifyDataAdapter ShopifyDataAdapter1 = new ShopifyDataAdapter("SELECT FirstName, Id FROM Customers", connection);
  DataTable table = new DataTable();
  ShopifyDataAdapter1.Fill(table);
  DevExpress.XtraCharts.Series series = new Series("Series1", ViewType.Bar);
  WebChartControl1.Series.Add(series);
  DataTable table = new DataTable();
  series.ValueDataMembers.AddRange(new string[] { "Id" });
  series.ArgumentScaleType = ScaleType.Qualitative;
  series.ArgumentDataMember = "FirstName";
  series.ValueScaleType = ScaleType.Numerical;
  ((DevExpress.XtraCharts.SideBySideBarSeriesView)series.View).ColorEach = true;
}