Discover how a bimodal integration strategy can address the major data management challenges facing your organization today.
Get the Report →


Visualize your Salesforce Data in Tibco Spotfire
This article walks you through using the CData ADO.NET Provider for Salesforce in TIBCO Spotfire. You will establish a connection and create a simple dashboard. Because the dashboard is based on external data rather than a local cache, the dashboard can reflect changes in real time. You can use the same steps to work with any CData ADO.NET Provider in TIBCO Spotfire.
![]()
- Add the CData ADO.NET data source by clicking Add Data Tables.
- If you want to work with the live data, click the Keep Data Table External option. This option enables your dashboards to reflect changes to the data in real time. It can also reduce network load times when working with large volumes of data.
If you want to load the data into memory and process the data locally, click the Import Data Table option. This option is better for offline use or if a slow connection is making your dashboard less interactive.
- Click Add Database.
- Select the provider and click Configure.
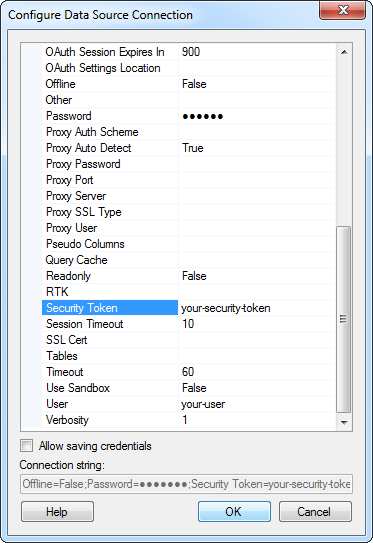
- Define the connection settings. The required connection properties are User, Password, and Access Token. Alternatively, OAuth is also supported. See the "Getting Started" chapter in the help documentation for a guide to authenticating with OAuth.
![]()
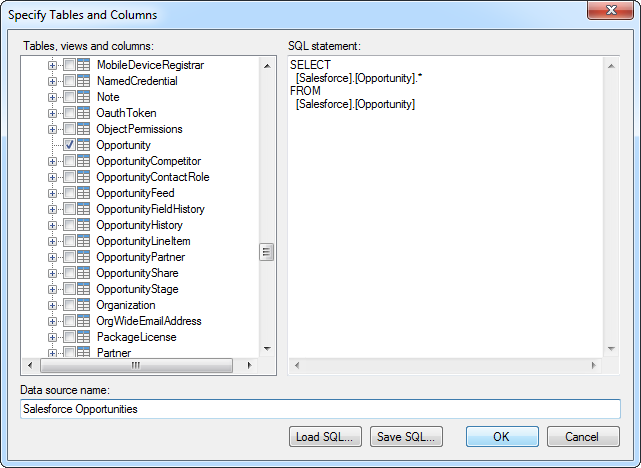
- Select the tables that you want to add to the dashboard. You can also specify an SQL query. The driver supports the standard SQL syntax. The supported SQL is limited to the capabilities of the Salesforce API.
![]()
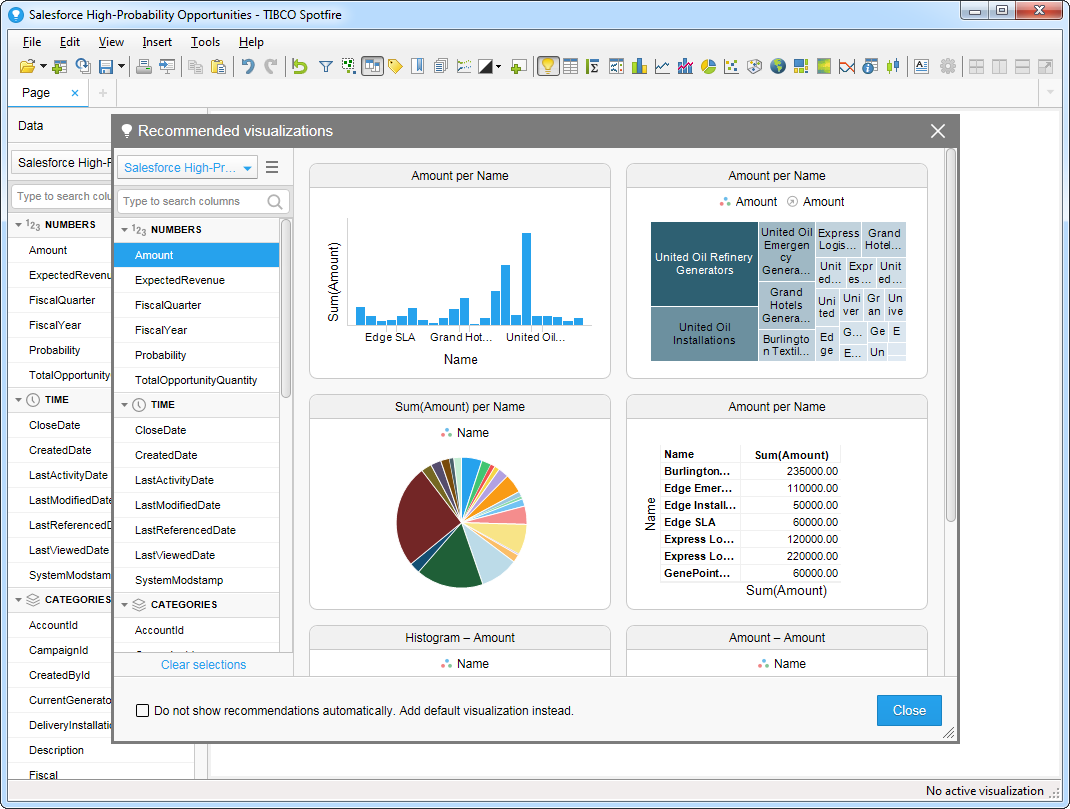
- After adding tables, the Recommended Visualizations wizard is displayed. When you select a table, Spotfire loads the metadata and, based on the data type, detects number, time, and category type columns. As you select columns, a variety of data visualizations are generated: Spotfire generates the corresponding SQL query, containing aggregate functions such as SUM and COUNT, and executes it to the driver. This example uses Amount in the Numbers section and Name in the Category column.
![]()
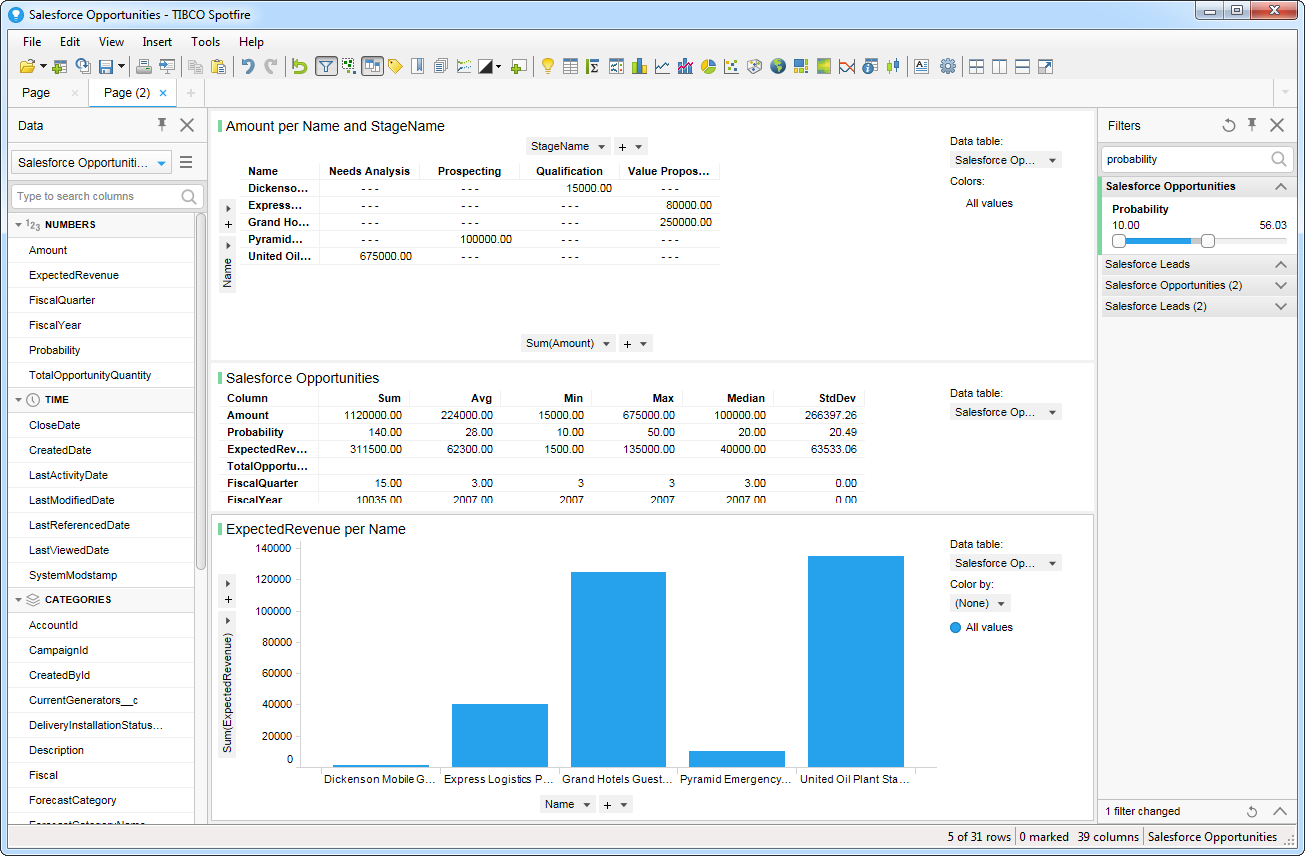
After adding several visualizations in the Recommended Visualizations wizard, you can make other modifications. For example, you can zoom in on high probability opportunities by applying a filter on the page. To add a filter, click the Filter button. The available filters for each table are displayed in the Filters pane.
Data Connectors
ETL/ ELT Solutions
Cloud & API Connectivity
OEM & Custom Drivers