Discover how a bimodal integration strategy can address the major data management challenges facing your organization today.
Get the Report →Create Reports with Amazon S3 Data in SAP Crystal Reports
Use the Report Wizard to design a report based on up-to-date Amazon S3 data.
Crystal Reports has many options for offloading data processing to remote data; this enables real-time reporting. The CData ODBC Driver for Amazon S3 brings this capability to Crystal Reports. This article shows how to create a report on Amazon S3 data that refreshes when you run the report.
Refer to the given table for the tools and versions used for this article:
| Application Name | Version |
|---|---|
| SAP Crystal Reports 2020 | SP3 |
| ODBC Driver | 23.0.8565 |
Connect to Amazon S3 Data
If you have not already, specify connection properties in an ODBC DSN (data source name). This is the last step of the driver installation. You can use the Microsoft ODBC Data Source Administrator to create and configure ODBC DSNs.
To authorize Amazon S3 requests, provide the credentials for an administrator account or for an IAM user with custom permissions. Set AccessKey to the access key Id. Set SecretKey to the secret access key.
Note: You can connect as the AWS account administrator, but it is recommended to use IAM user credentials to access AWS services.
For information on obtaining the credentials and other authentication methods, refer to the Getting Started section of the Help documentation.
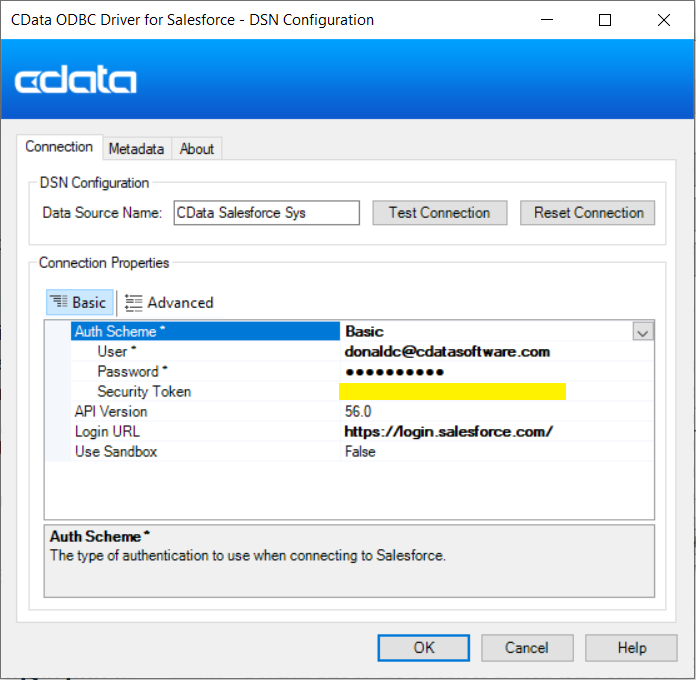
When configuring the DSN, you may also want to set the Max Rows connection property. This will limit the number of rows returned, which is especially helpful for improving performance when designing reports and visualizations.
Design a Report in SAP Crystal Reports
Follow the procedure below to use the SAP Crystal Reports tool to create the Amazon S3 connection and Design a Report.
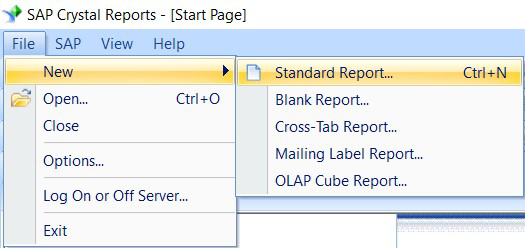
- File -> New -> Standard Report.
![Create a standard report. Create a standard report.]()
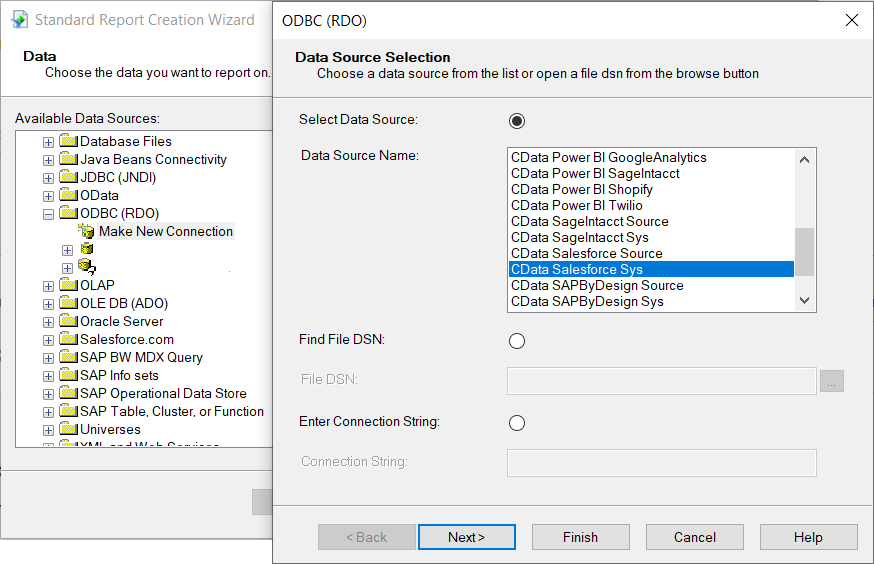
- Expand the ODBC (RDO) node under Create New Connection and double-click on "Make a New Connection". Select CData Amazon S3 Sys or any other source to prepare the report. Click on NEXT and FINISH.
![Data Source Selection Data Source Selection]()
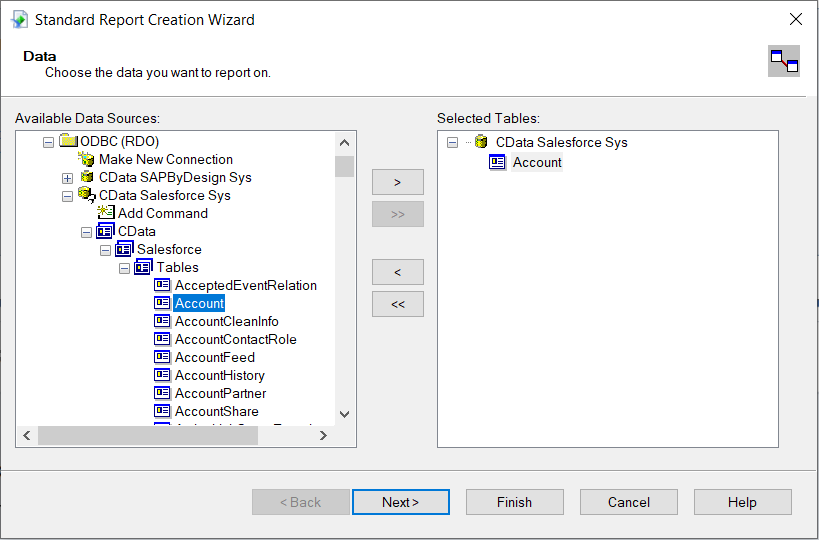
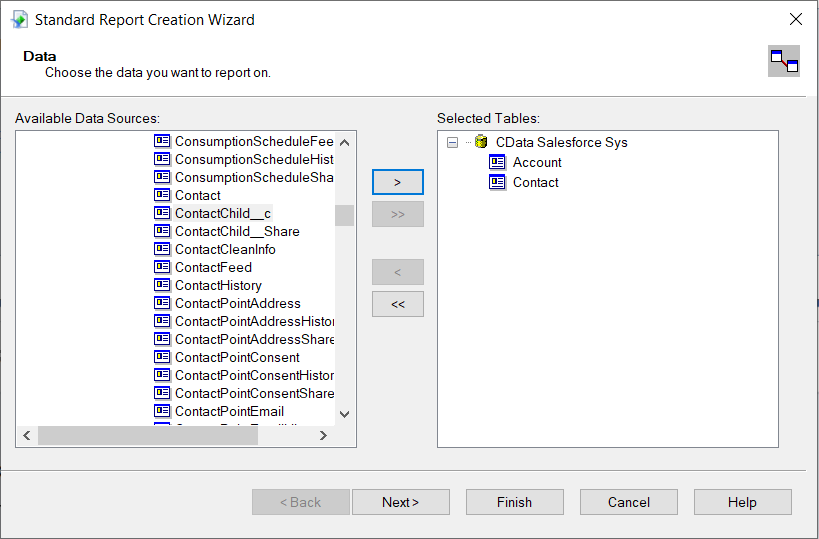
- Configure the data source by selecting the tables needed in the report and clicking NEXT.
![Add the table. Add the table.]()
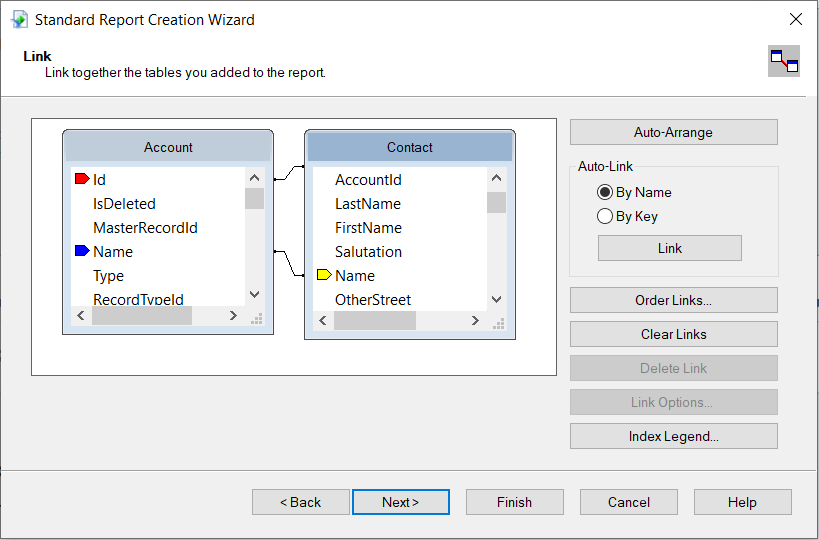
- You can also link tables from the Amazon S3 data in SAP Crystal Reports. Click on NEXT after adding the links between tables.
![Add multiple tables. Add multiple tables.]()
![Link the tables. Link the tables.]()
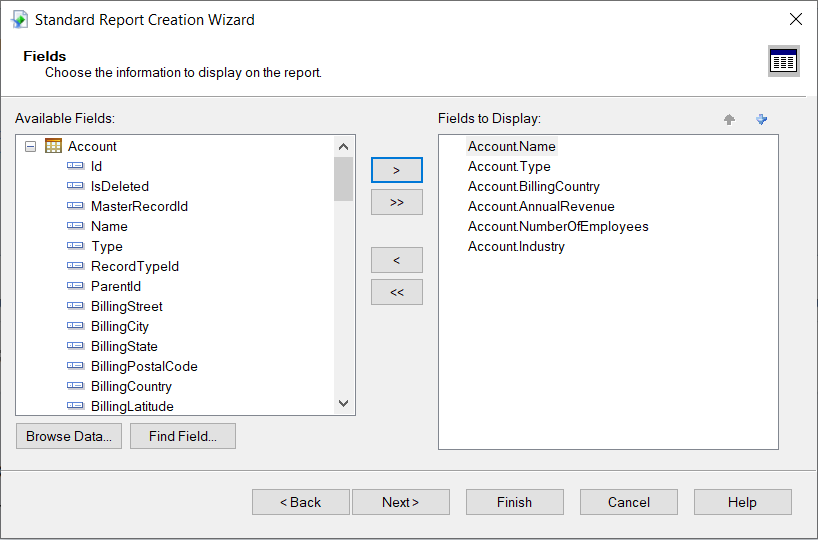
- After the tables are selected, select the fields you want displayed in the report from the selected table, followed by NEXT.
![Add the fields to display. Add the fields to display.]()
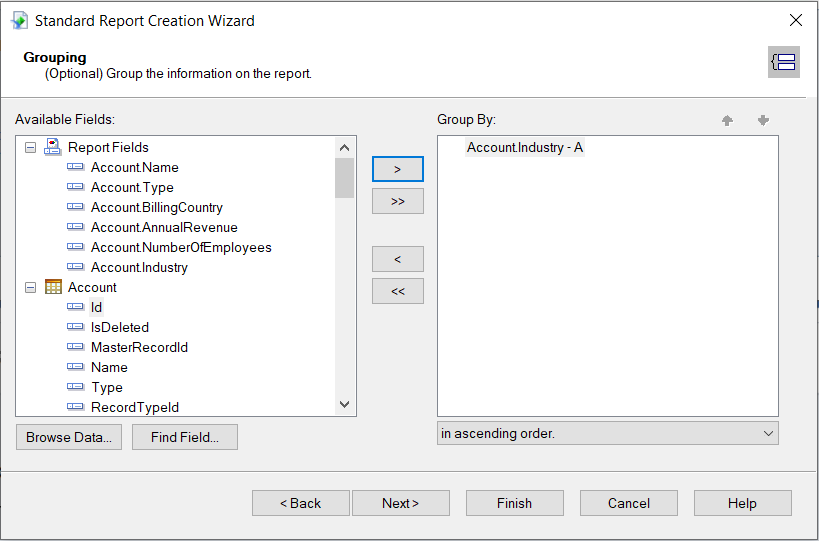
- Select the "Group By" field to group the information on the report.
![Add the Group By field. Add the Group By field.]()
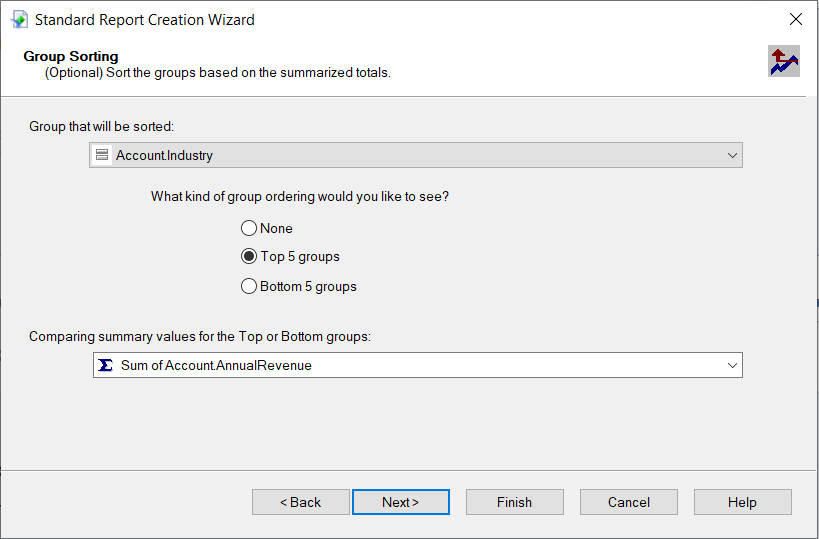
- Sort the groups based on summarised totals and click on NEXT.
![Group Sorting Group Sorting]()
Create a Chart
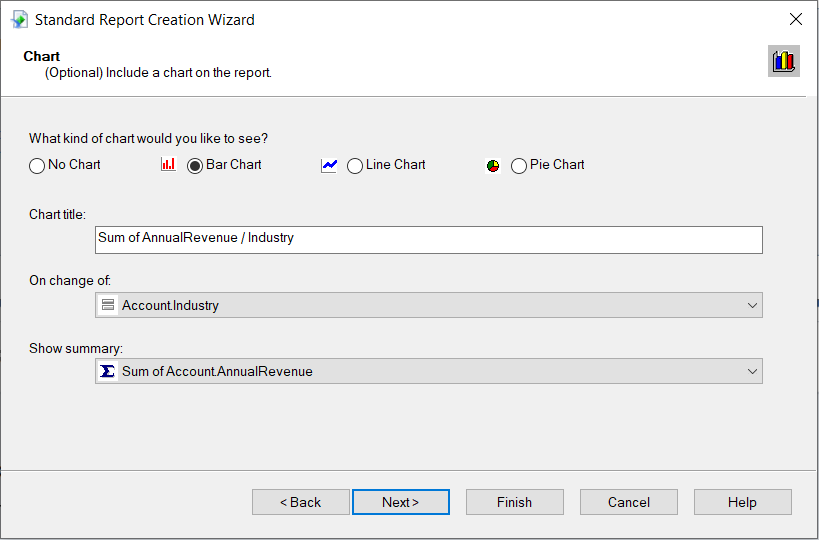
After selecting a column to group by, the Standard Report Creation Wizard presents the option to create a chart. Follow the steps below to create a chart aggregating the Name column's values.
- In the Standard Report Creation Wizard, select the Bar Chart option and select the column you grouped by in the "On change of" menu.
- In the Show Summary menu, select the summary you created.
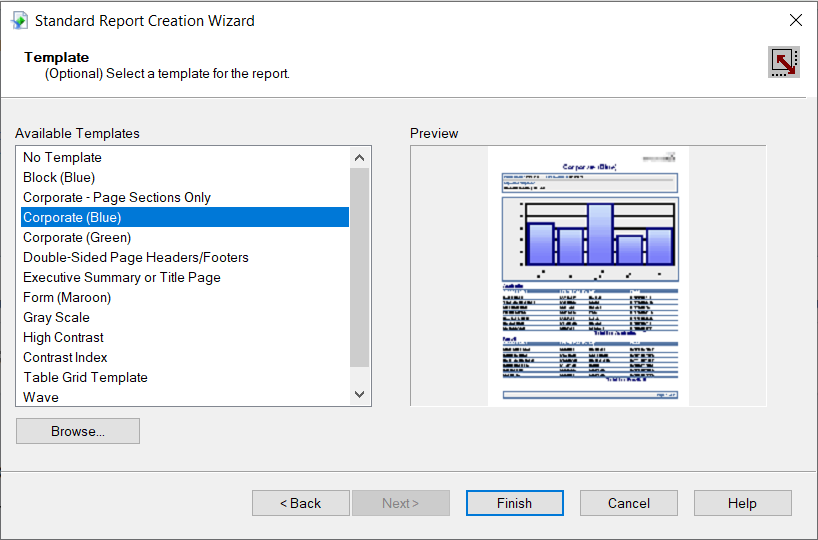
- Select filters and a template, as needed, to finish the wizard.
![Select a chart type. Select a chart type.]()
Select a template for the report to preview the finished report and view the chart populated with your data.
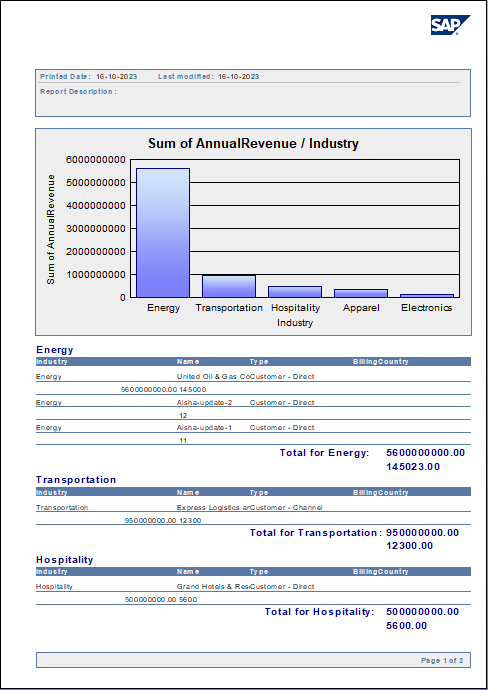
The Final Report
You can now see that the report contains all the fields specified.
Working with Remote Data
To ensure that you see updates to data, click File and clear the "Save Data with Report" option. As you interact with the report, for example, drilling down to hidden details, Crystal Reports executes SQL queries to retrieve the data needed to display the report. To reload data you have already retrieved, refresh or rerun the report.
You can offload processing onto the driver by hiding details elements and enabling server-side grouping. To do this, you need to select a column to group by in the report creation wizard.
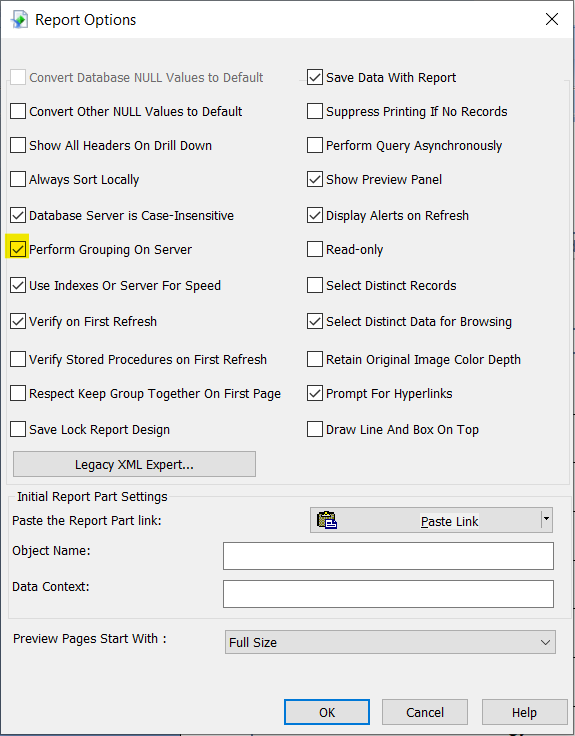
- Click File -> Report Options and select the "Perform Grouping On Server" option.
![Perform Grouping On Server option. Perform Grouping On Server option.]()
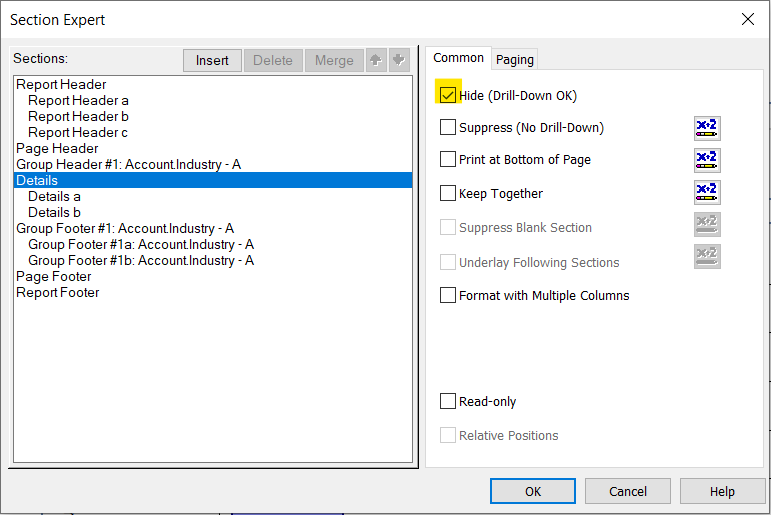
- Click Report -> Section Expert and select the Details section of your report. Select the "Hide (Drill-Down OK)" option.
![Hide (Drill-Down OK) option. Hide (Drill-Down OK) option.]()
When you preview your report with the hidden details, Crystal Reports executes a GROUP BY query. When you double-click a column in the chart to drill down to details, Crystal Reports executes a SELECT WHERE query that decreases load times by retrieving only the data needed.
At this point, you have created a SAP Crystal report built on top of live Amazon S3 data using SAP Crystal Reports and CData ODBC Driver. Learn more about the CData ODBC Driver for Amazon S3 and download a free trial from the CData ODBC Driver for Amazon S3 page. Let our Support Team know if you have any questions.


