Discover how a bimodal integration strategy can address the major data management challenges facing your organization today.
Get the Report →Publish Jira Service Desk-Connected Dashboards in Tableau Server
Use CData Tableau Connectors and Tableau Server to visualize live Jira Service Desk data.
Tableau Server is a visual analytics platform transforming the way businesses use data to solve problems. When paired with the CData Tableau Connector for Jira Service Desk, you get access to live Jira Service Desk data within Tableau Server. This article shows how to connect to Jira Service Desk in Tableau Desktop, publish a Data Source to Tableau Server, and build a simple chart from that data.
The CData Tableau Connectors enable high-speed access to live Jira Service Desk data in Tableau Server. Once you install the connector, you simply authenticate with Jira Service Desk and you can immediately start building responsive, dynamic visualizations and dashboards. By surfacing Jira Service Desk data using native Tableau data types and handling complex filters, aggregations, & other operations automatically, CData Tableau Connectors grant seamless access to Jira Service Desk data.
NOTE: The CData Tableau Connectors require Tableau 2020.3 or higher. If you are using an older version of Tableau, you will need to use the CData Tableau Connector for Jira Service Desk. If you wish to connect to Jira Service Desk data in Tableau Cloud, you will need to use CData Connect Cloud.
Enable Connectivity to Jira Service Desk in Tableau Server
Start by installing the CData Tableau Connector on the machine hosting Tableau Server.
Installation on a Linux Machine:
- Unpack the setup.zip archive. Creating a directory for the connector like /opt/cdata/jiraservicedesk is recommended, but the exact install location does not matter.
- Navigate to the lib subdirectory under the install directory. Generate a license file by running this command and following the prompts:
java -jar cdata.tableau.jiraservicedesk.jar -l - Copy cdata.tableau.jiraservicedesk.jar and cdata.tableau.jiraservicedesk.lic into the drivers directory, /opt/tableau/tableau_driver/jdbc.
- Copy cdata.jiraservicedesk.taco into the connectors directory, MyTableauServerRootDir/data/tabsvc/vizqlserver/Connectors. In most cases MyTableauServerRootDir is located at /var/opt/tableau/tableau_server.
- Restart Tableau Server.
If you cannot execute the java commmand from step 2, you will need to install a Java runtime environment. The name of this package differs on Red Hat-based and Debian-based systems:
| OS | Java Package |
|---|---|
| Ubuntu | openjdk-8-jre-headless |
| Debian | openjdk-8-jre-headless |
| RHEL | java-1.8.0-openjdk |
| CentOS | java-1.8.0-openjdk |
| Fedora | java-1.8.0-openjdk |
| SUSE | java-1_8_0-openjdk |
You can substitute Java 8 with a later Java release as needed.
Installation on a Windows Machine:
- Run the setup.exe installer. The driver JAR file will be automatically placed in the drivers directory, C:\Program Files\Tableau\Drivers.
- Navigate to the lib folder under the installation directory. By default the installation directory is a folder in C:\Program Files\CData.
- Copy cdata.tableau.jiraservicedesk.lic into the drivers directory.
- Copy cdata.tableau.jiraservicedesk.taco into the connectors directory, MyTableauServerRootDir/data/tabsvc/vizqlserver/Connectors. In most cases MyTableauServerRootDir is located under C:\ProgramData.
- Restart Tableau Server.
Connect to Jira Service Desk in Tableau Desktop
Once the connectors are installed on the Server machine, we can configure a connection to Jira Service Desk in Tableau Desktop and publish a Jira Service Desk-based Data Source to Tableau Server.
- Open Tableau Desktop.
- Click More under Connect -> To a Server.
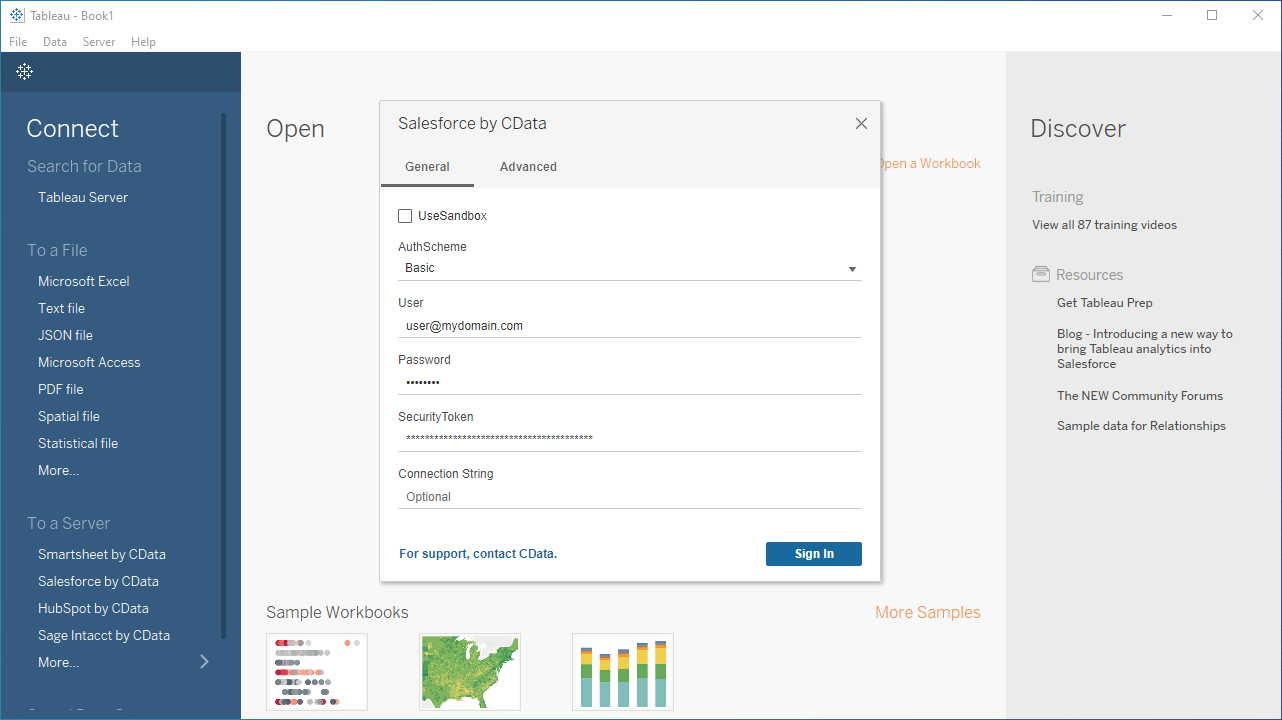
- Select "Jira Service Desk by CData".
- Configure the connection to the data.
You can establish a connection to any Jira Service Desk Cloud account or Server instance.
Connecting with a Cloud Account
To connect to a Cloud account, you'll first need to retrieve an APIToken. To generate one, log in to your Atlassian account and navigate to API tokens > Create API token. The generated token will be displayed.
Supply the following to connect to data:
- User: Set this to the username of the authenticating user.
- APIToken: Set this to the API token found previously.
Connecting with a Service Account
To authenticate with a service account, you will need to supply the following connection properties:
- User: Set this to the username of the authenticating user.
- Password: Set this to the password of the authenticating user.
- URL: Set this to the URL associated with your JIRA Service Desk endpoint. For example, https://yoursitename.atlassian.net.
Note: Password has been deprecated for connecting to a Cloud Account and is now used only to connect to a Server Instance.
Accessing Custom Fields
By default, the connector only surfaces system fields. To access the custom fields for Issues, set IncludeCustomFields.
- Click "Sign In".
Discover Schemas and Query Data
Once you establish the connection to Jira Service Desk data, you can configure which entities to visualize.
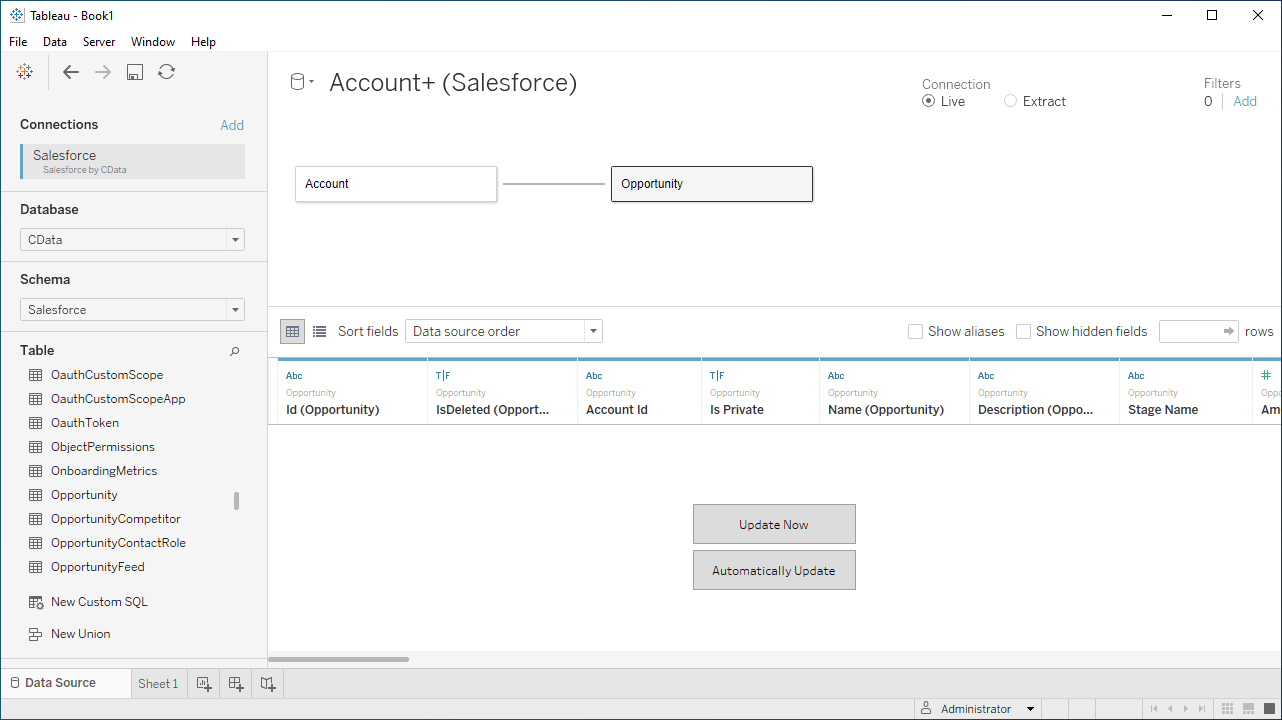
- Select CData from the Database pull-down menu.
- Select JiraServiceDesk from the Schema pull-down menu.
- Drag the tables and views you wish to visualize onto the join area. You can include multiple tables.
![Selecting table(s)]()
- Select Update Now or Automatically Update. Update Now lets you preview the first 10,000 rows of the data source (or enter the number of rows you want to see in the Rows text box). Automatically Update auto-loads the changes in the preview area.
Publish Data to Tableau Server
After you configure the data you wish to visualize, you can publish the Data Source to a Tableau Server instance. In Tableau Desktop:
- Click Server -> Sign In.
- Enter the URL for your Tableau Server.
- Authenticate with Tableau Server credentials.
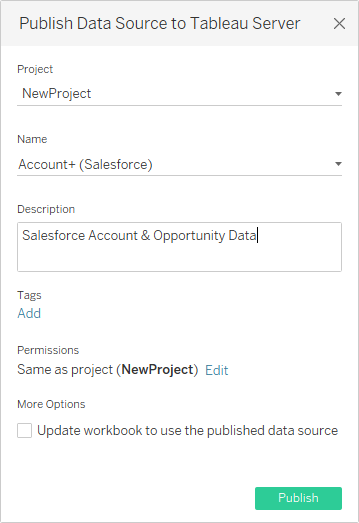
- Click Server -> Publish Data Source and select your data source.
- Click Publish.
- Select the Project, name the Data Source, and optionally add a description.
- Click Publish.
![Publish the Data Source to Tableau Server]()
This creates a new entry under the server's data source list, from which you an change the data source's permissions, view its history, and perform other management tasks.
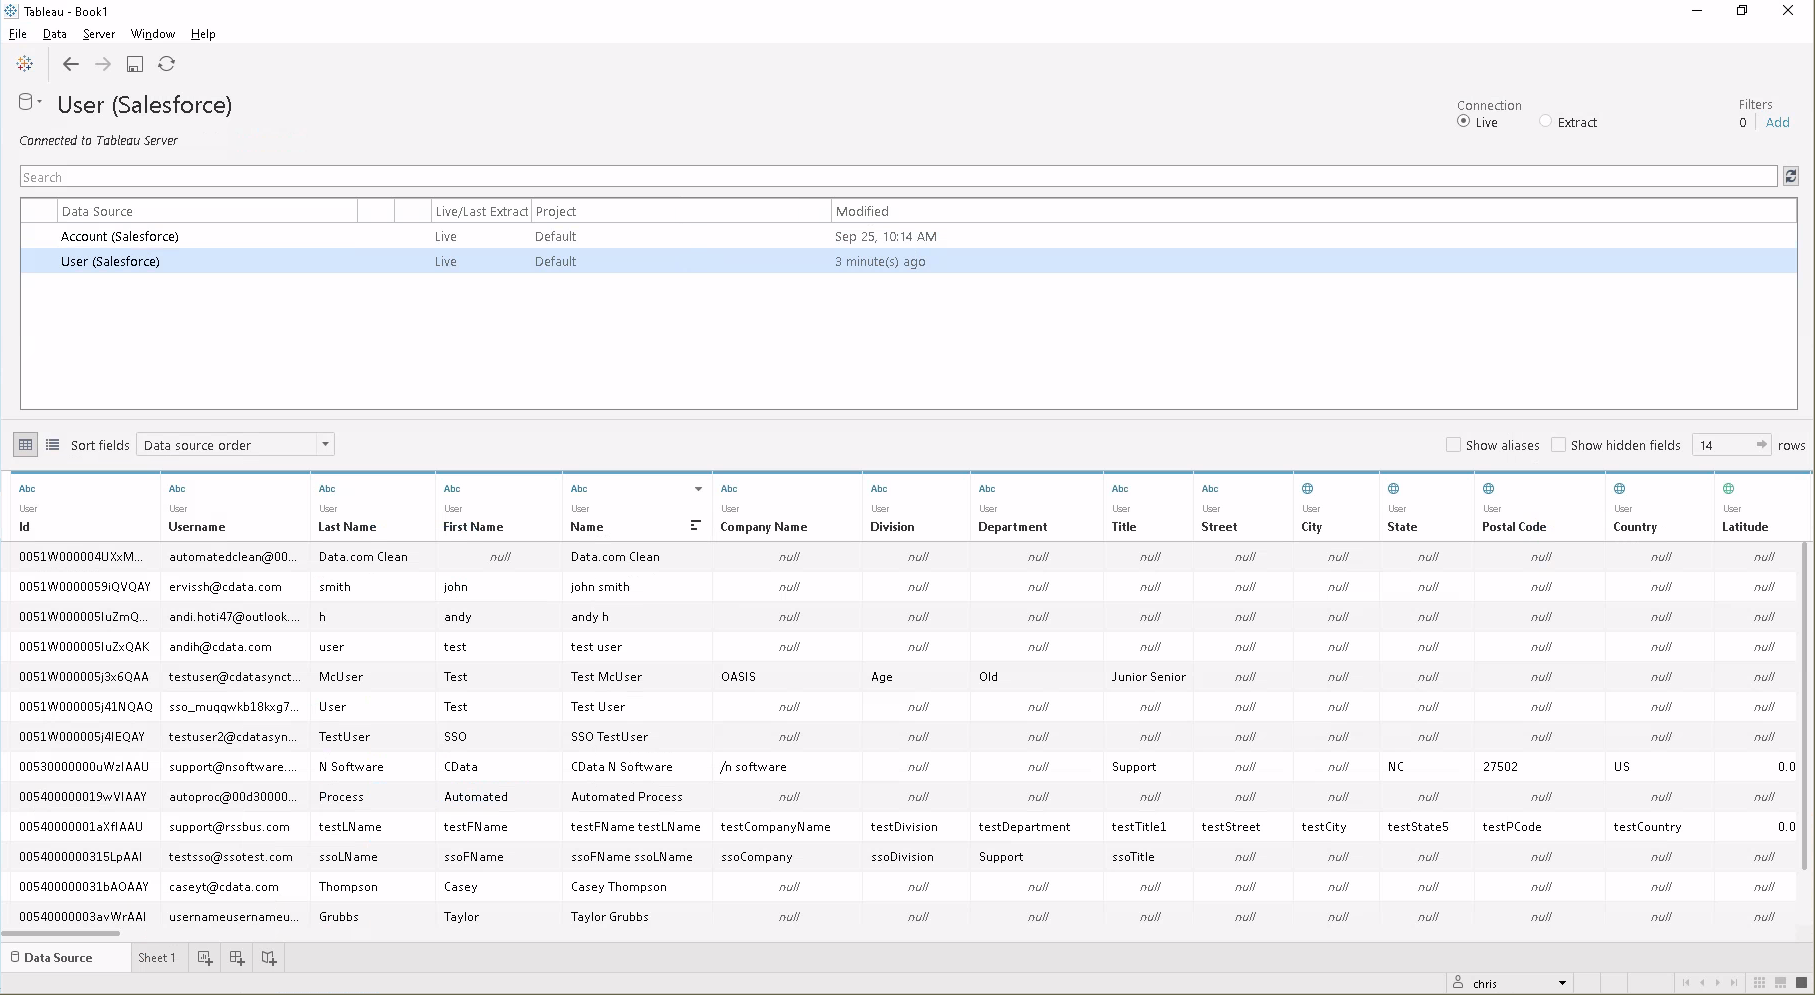
Note that workstation connected to the same server will be able to use the same source in Tableau Desktop, even if the connector isn't installed there. Also, workbooks created directly on Tableau Server (via the web interface) can use this source.
Visualize Jira Service Desk Data in Tableau Server
With the Data Source published to Tableau Server, you are ready to visualize Jira Service Desk data.
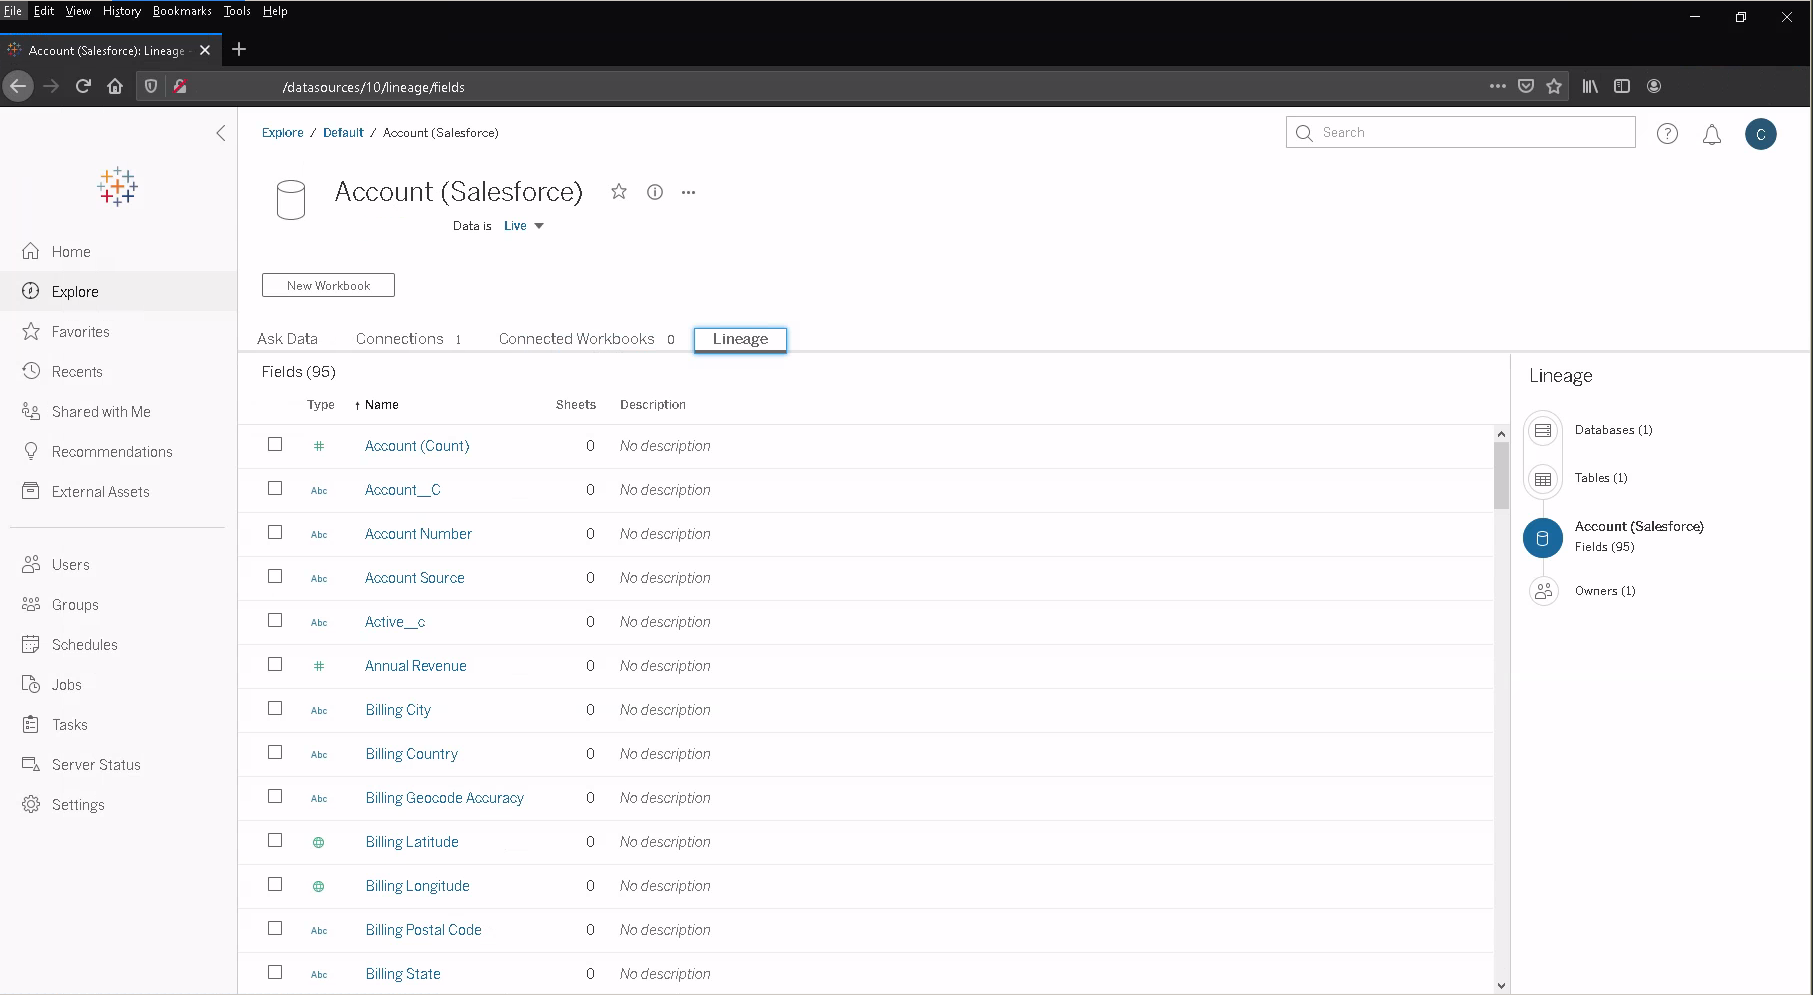
- Login to your Tableau Server instance.
- Connect to the remote source using the Search for Data -> Tableau Server in the Connect sidebar.
![Remote Data Source]()
- Click the published Data Source.
- Click New Workbook.
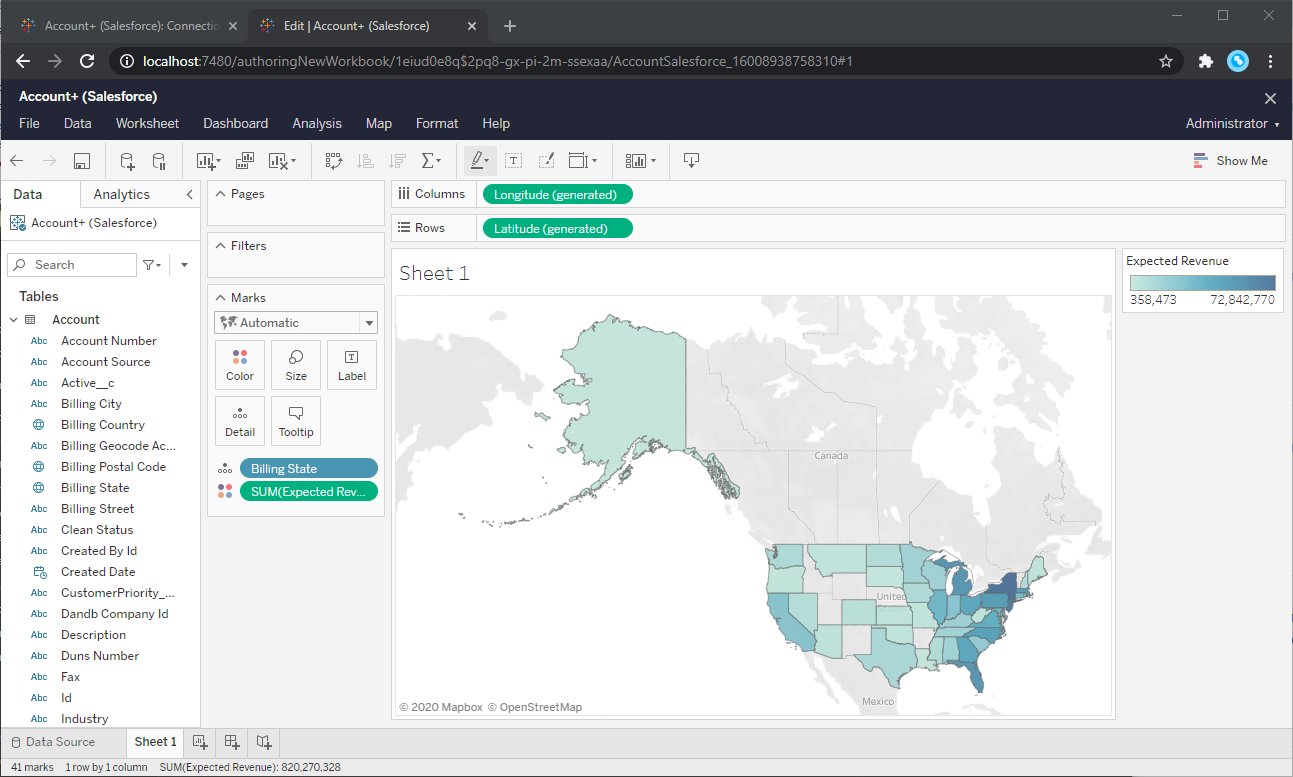
- In the workbook, Jira Service Desk fields are listed as Dimensions and Measures, depending on the data type. The CData Tableau Connector discovers data types automatically, allowing you to leverage the powerful data processing and visualization features of Tableau.
- Drag a field from the Dimensions or Measures area to Rows or Columns. Tableau creates column or row headers.
- Select one of the chart types from the Show Me tab. Tableau displays the chart type that you selected.
![Visualizing live Jira Service Desk data in Tableau Server]()
Using the CData Tableau Connector for Jira Service Desk with Tableau Server, you can easily create robust visualizations and reports on Jira Service Desk data. Download a free, 30-day trial and get started today.

