Discover how a bimodal integration strategy can address the major data management challenges facing your organization today.
Get the Report →Build SQL Analysis Services Visualizations in Tableau Cloud
Use CData Connect Server to create a virtual SQL Server Database for SQL Analysis Services data and build visualizations in Tableau Cloud.
Tableau Cloud is an analytics platform fully hosted in the cloud. When paired with CData Connect Server, you get instant, cloud-to-cloud access to SQL Analysis Services data for visualizations, dashboards, and more. This article shows how to create a virtual database for SQL Analysis Services and build visualizations from SQL Analysis Services data in Tableau Cloud.
CData Connect Server provides a pure SQL Server interface for SQL Analysis Services, allowing you to easily build visualizations from live SQL Analysis Services data in Tableau Cloud without installing connectors or publishing worksheets and data sources from Tableau Desktop. As you build visualizations, Tableau Cloud generates SQL queries to gather data. Using optimized data processing out of the box, CData Connect Server pushes all supported SQL operations (filters, JOINs, etc) directly to SQL Analysis Services, leveraging server-side processing to quickly return SQL Analysis Services data.
Create a Virtual SQL Server Database for SQL Analysis Services Data
CData Connect Server uses a straightforward, point-and-click interface to connect to data sources and generate APIs.
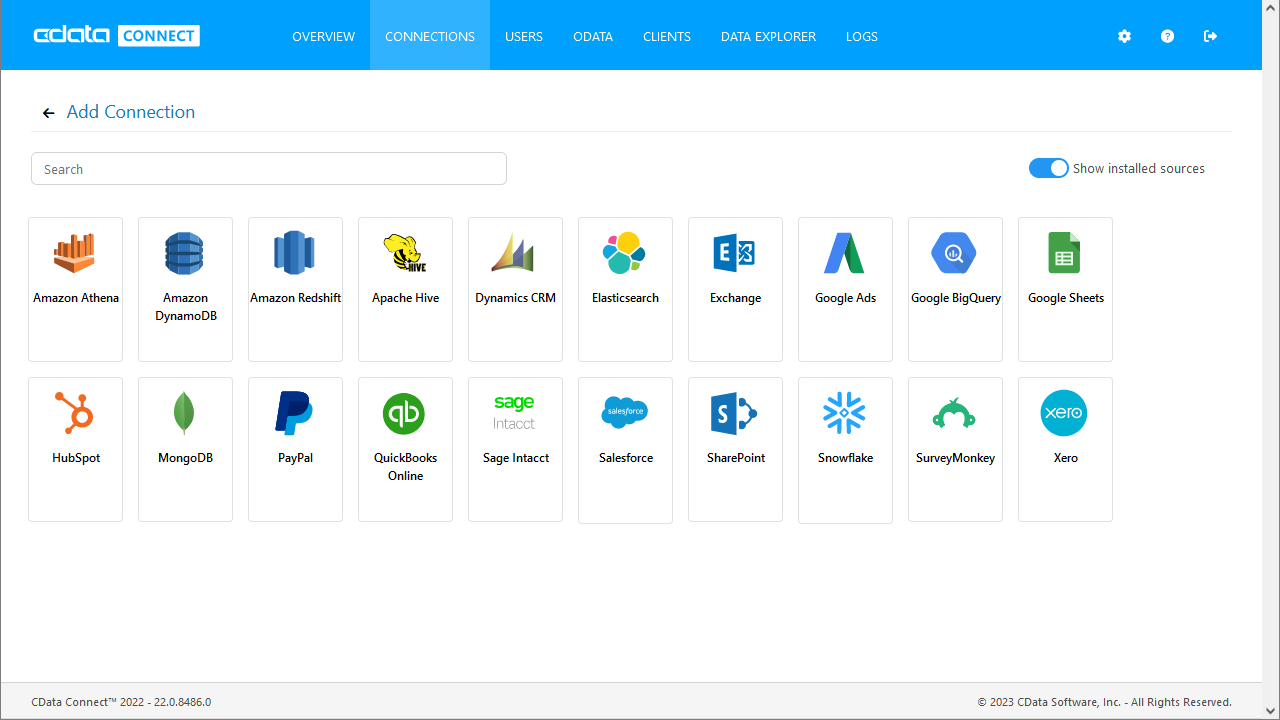
- Login to Connect Server and click Connections.
![Adding a connection]()
- Select "SQL Analysis Services" from Available Data Sources.
-
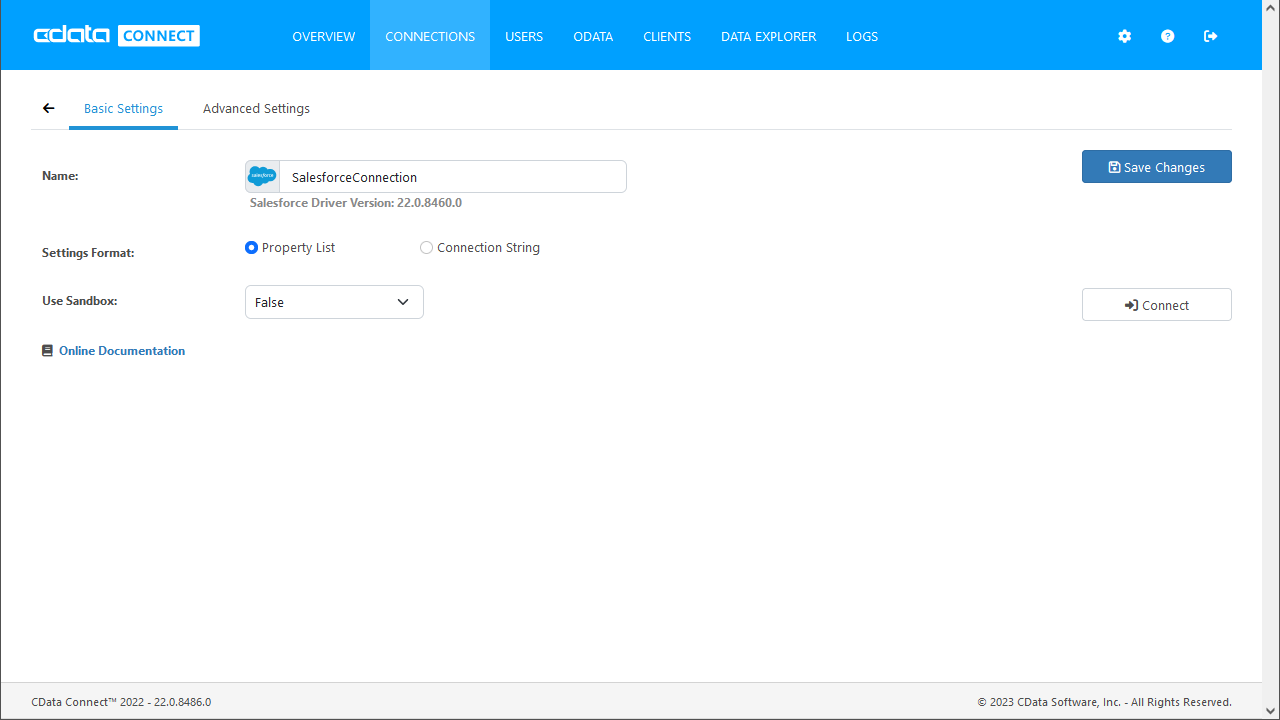
Enter the necessary authentication properties to connect to SQL Analysis Services.
To connect, provide authentication and set the Url property to a valid SQL Server Analysis Services endpoint. You can connect to SQL Server Analysis Services instances hosted over HTTP with XMLA access. See the Microsoft documentation to configure HTTP access to SQL Server Analysis Services.
To secure connections and authenticate, set the corresponding connection properties, below. The data provider supports the major authentication schemes, including HTTP and Windows, as well as SSL/TLS.
-
HTTP Authentication
Set AuthScheme to "Basic" or "Digest" and set User and Password. Specify other authentication values in CustomHeaders.
-
Windows (NTLM)
Set the Windows User and Password and set AuthScheme to "NTLM".
-
Kerberos and Kerberos Delegation
To authenticate with Kerberos, set AuthScheme to NEGOTIATE. To use Kerberos delegation, set AuthScheme to KERBEROSDELEGATION. If needed, provide the User, Password, and KerberosSPN. By default, the data provider attempts to communicate with the SPN at the specified Url.
-
SSL/TLS:
By default, the data provider attempts to negotiate SSL/TLS by checking the server's certificate against the system's trusted certificate store. To specify another certificate, see the SSLServerCert property for the available formats.
You can then access any cube as a relational table: When you connect the data provider retrieves SSAS metadata and dynamically updates the table schemas. Instead of retrieving metadata every connection, you can set the CacheLocation property to automatically cache to a simple file-based store.
See the Getting Started section of the CData documentation, under Retrieving Analysis Services Data, to execute SQL-92 queries to the cubes.
![Configuring a connection (SQL Server is shown).]()
-
HTTP Authentication
- Click Save Changes
- Click Privileges -> Add and add the new user (or an existing user) with the appropriate permissions.
With the virtual database created, you are ready to build visualizations in Tableau Cloud.
Visualize Live SQL Analysis Services Data in Tableau Cloud
The steps below outline creating a new data source in Tableau Cloud based on the virtual SQL Analysis Services database in Connect Server and building a simple visualization from the data.
- Log into Tableau Cloud, select a project, and create a new workbook.
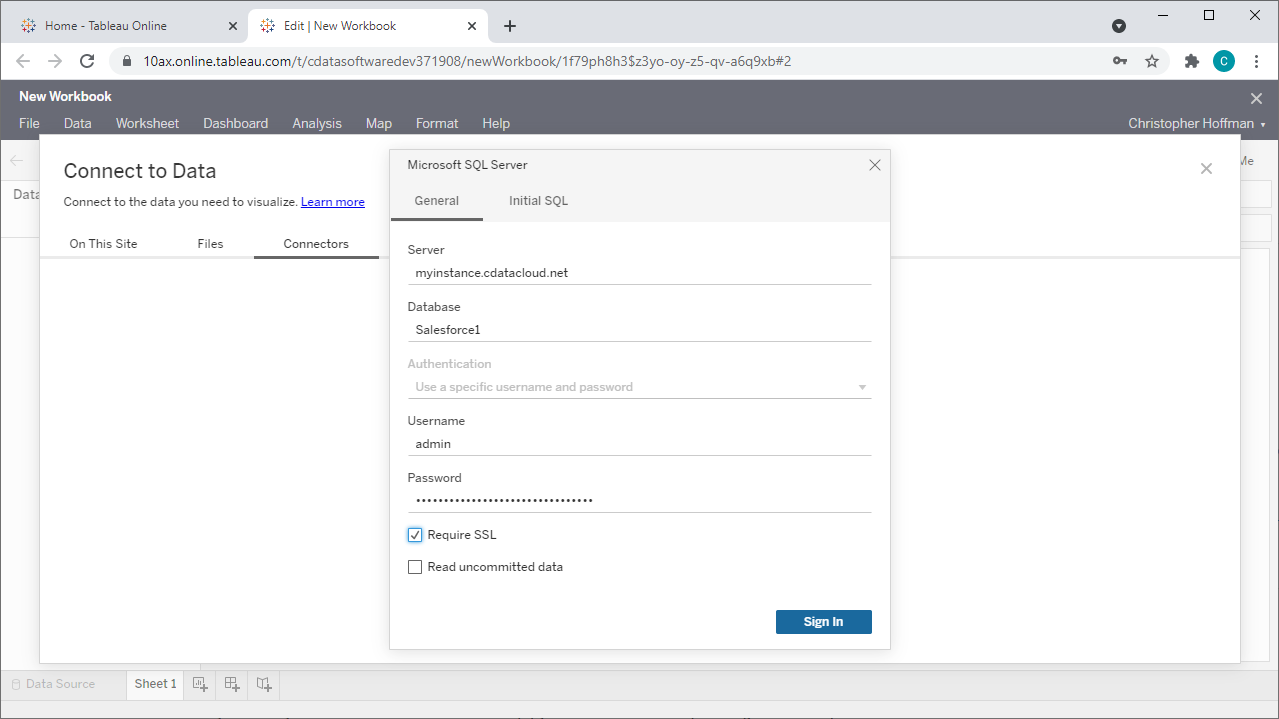
- In the new workbook, choose the Microsoft SQL Server Connector from the data wizard and fill in the values for your Connect Server instance.
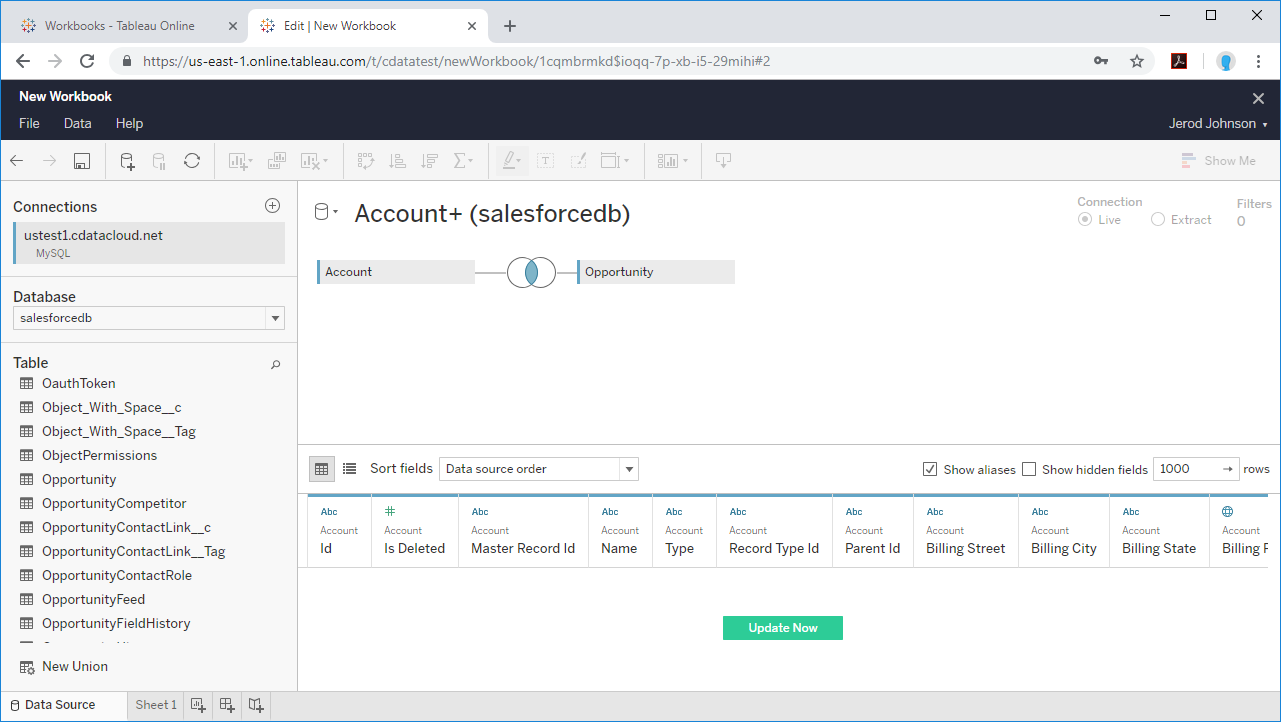
NOTE: Be sure to check the "Require SSL" checkbox. - Select your newly created database and the table(s) you wish to visualize (defining relationships for JOINed tables as needed).
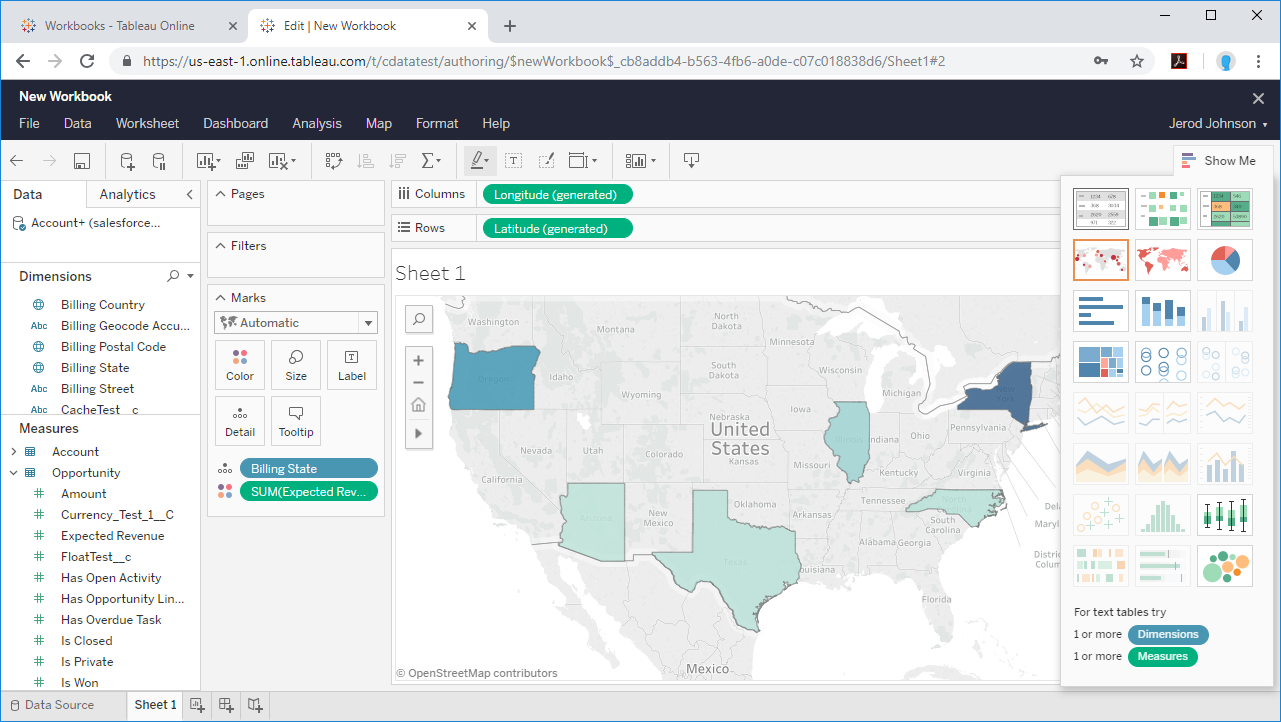
- Select Dimensions and Measures and configure your visualization.
SQL Access to SQL Analysis Services Data from Applications
At this point, you have a direct connection to live SQL Analysis Services data from your Tableau Cloud workbook. You can create new visualizations, build dashboards, and more, with no need to publish data sources and workbooks from Tableau Desktop. For more information on gaining SQL access to data from more than 100 SaaS, Big Data, and NoSQL sources from cloud applications like Tableau Cloud, refer to our Connect Server page.

