Discover how a bimodal integration strategy can address the major data management challenges facing your organization today.
Get the Report →DataBind XML Data to the DevExpress Data Grid
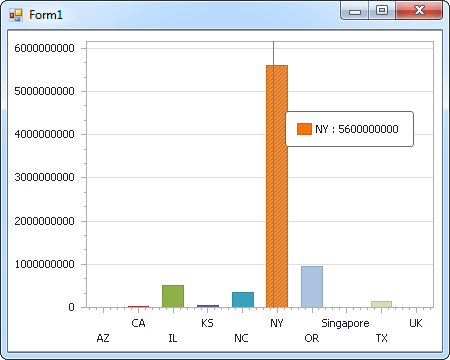
Use the CData ADO.NET Provider for XML with the DevExpress Windows Forms and Web controls to provide XML data to a chart.
The ADO.NET Provider for XML by CData incorporates conventional ADO.NET data access components compatible with third-party controls. You can adhere to the standard ADO.NET data binding procedures to establish two-way access to real-time data through UI controls. This article will demonstrate the utilization of CData components for data binding with DevExpress UI Controls (Windows Forms and Web controls), specifically binding to a chart that visualizes live data.
See the Getting Started chapter in the data provider documentation to authenticate to your data source: The data provider models XML APIs as bidirectional database tables and XML files as read-only views (local files, files stored on popular cloud services, and FTP servers). The major authentication schemes are supported, including HTTP Basic, Digest, NTLM, OAuth, and FTP. See the Getting Started chapter in the data provider documentation for authentication guides.
After setting the URI and providing any authentication values, set DataModel to more closely match the data representation to the structure of your data.
The DataModel property is the controlling property over how your data is represented into tables and toggles the following basic configurations.
- Document (default): Model a top-level, document view of your XML data. The data provider returns nested elements as aggregates of data.
- FlattenedDocuments: Implicitly join nested documents and their parents into a single table.
- Relational: Return individual, related tables from hierarchical data. The tables contain a primary key and a foreign key that links to the parent document.
See the Modeling XML Data chapter for more information on configuring the relational representation. You will also find the sample data used in the following examples. The data includes entries for people, the cars they own, and various maintenance services performed on those cars.
Windows Forms Controls
The code below shows how to populate a DevExpress chart with XML data. The XMLDataAdapter binds to the Series property of the chart control. The Diagram property of the control defines the x- and y-axes as the column names.
using (XMLConnection connection = new XMLConnection(
"URI=C:/people.xml;DataModel=Relational;")) {
  XMLDataAdapter dataAdapter = new XMLDataAdapter(
  "SELECT [people].[personal.age] AS age, [people].[personal.gender] AS gender, [people].[personal.name.first] AS first_name, [people].[personal.name.last] AS last_name, [vehicles].[model], FROM [people] JOIN [vehicles] ON [people].[_id] = [vehicles].[people_id]", connection);

  DataTable table = new DataTable();
  dataAdapter.Fill(table);
  DevExpress.XtraCharts.Series series = new DevExpress.XtraCharts.Series();
  chartControl1.Series.Add(series);
  series.DataSource = table;
  series.ValueDataMembers.AddRange(new string[] { "[ personal.name.last ]" });
  series.ArgumentScaleType = DevExpress.XtraCharts.ScaleType.Qualitative;
  series.ArgumentDataMember = "[ personal.name.first ]";
  series.ValueScaleType = DevExpress.XtraCharts.ScaleType.Numerical;
  chartControl1.Legend.Visibility = DevExpress.Utils.DefaultBoolean.False;
  ((DevExpress.XtraCharts.SideBySideBarSeriesView)series.View).ColorEach = true;
}

Web Controls
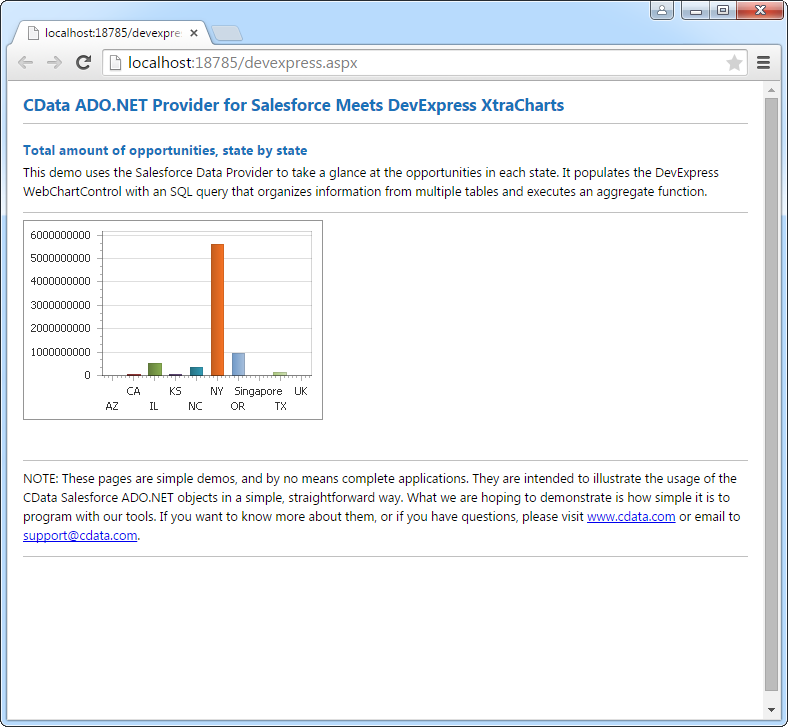
The code below shows how to populate a DevExpress Web control with XML data. The XMLDataAdapter binds to the Series property of the chart; the Diagram property defines the x- and y-axes as the column names.
using DevExpress.XtraCharts;

using (XMLConnection connection = new XMLConnection(
"URI=C:/people.xml;DataModel=Relational;"))
{
  XMLDataAdapter XMLDataAdapter1 = new XMLDataAdapter("SELECT [people].[personal.age] AS age, [people].[personal.gender] AS gender, [people].[personal.name.first] AS first_name, [people].[personal.name.last] AS last_name, [vehicles].[model], FROM [people] JOIN [vehicles] ON [people].[_id] = [vehicles].[people_id]", connection);
  DataTable table = new DataTable();
  XMLDataAdapter1.Fill(table);
  DevExpress.XtraCharts.Series series = new Series("Series1", ViewType.Bar);
  WebChartControl1.Series.Add(series);
  series.DataSource = table;
  series.ValueDataMembers.AddRange(new string[] { "[ personal.name.last ]" });
  series.ArgumentScaleType = ScaleType.Qualitative;
  series.ArgumentDataMember = "[ personal.name.first ]";
  series.ValueScaleType = ScaleType.Numerical;
  ((DevExpress.XtraCharts.SideBySideBarSeriesView)series.View).ColorEach = true;
}


