Discover how a bimodal integration strategy can address the major data management challenges facing your organization today.
Get the Report →Use the CData ODBC Driver for YouTube Analytics in SAS JMP
You can use the CData ODBC Driver to integrate YouTube Analytics data into the statistical analysis tools available in SAS JMP. This article shows how to use YouTube Analytics data in the Graph Builder and Query Builder.
You can use the CData ODBC Driver for YouTube Analytics to integrate live data into your statistical analysis with SAS JMP. The driver proxies your queries directly to the YouTube Analytics API, ensuring that your analysis reflects any changes to the data. The CData ODBC Driver supports the standard SQL used by JMP in the background as you design reports.
The YouTube Analytics API supports bidirectional access. This article shows how to access YouTube Analytics data into a report and create data visualization. It also shows how to use SQL to query and manipulate YouTube Analytics data from the JMP Query Builder.
Access YouTube Analytics Data as an ODBC Data Source
If you have not already, first specify connection properties in an ODBC DSN (data source name). This is the last step of the driver installation. You can use the Microsoft ODBC Data Source Administrator to create and configure ODBC DSNs.
YouTube Analytics uses the OAuth authentication standard. You can use the embedded CData OAuth credentials or you can register an application with Google to obtain your own.
In addition to the OAuth values, to access YouTube Analytics data set ChannelId to the Id of a YouTube channel. You can obtain the channel Id in the advanced account settings for your channel. If not specified, the channel of the currently authenticated user will be used.
If you want to generate content owner reports, specify the ContentOwnerId property. This is the Id of the copyright holder for content in YouTube's rights management system. The content owner is the person or organization that claims videos and sets their monetization policy.
When you configure the DSN, you may also want to set the Max Rows connection property. This will limit the number of rows returned, which is especially helpful for improving performance when designing reports and visualizations.
Import YouTube Analytics Data with the Query Builder
After you have created the YouTube Analytics DSN, you can use SQL to invoke the capabilities of the YouTube Analytics API. Follow the steps below to execute some supported queries in the Query Builder:
- In SAS JMP, click File -> Database -> Query Builder. The Select Database Connection dialog is displayed.
- Click New Connection.
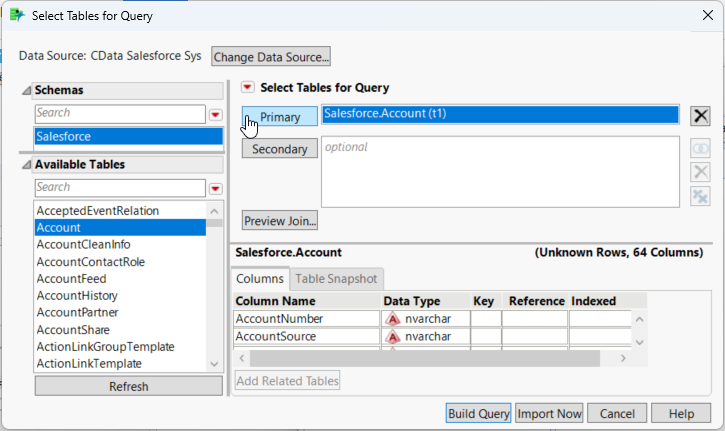
- On the Machine Data Source tab, select the DSN. In the next step, the Select Tables for Query dialog is displayed.
- In the Available Tables section, select a table and click Primary.
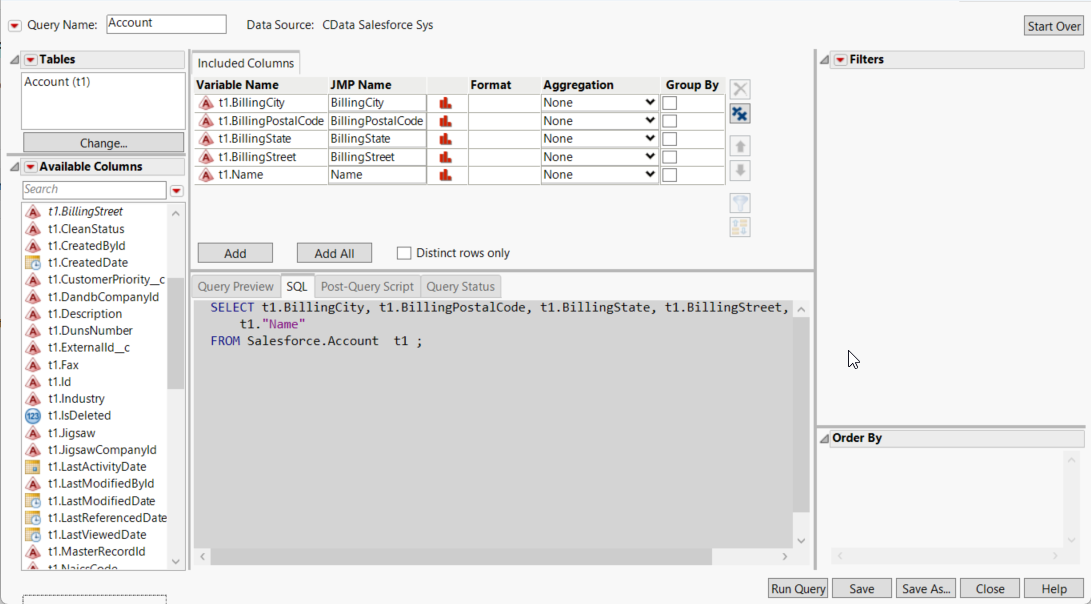
- As you drag Available Columns to the Included Columns tab, the underlying SQL query is updated.
![The generated query in the Query Builder. (Salesforce is shown.)]()
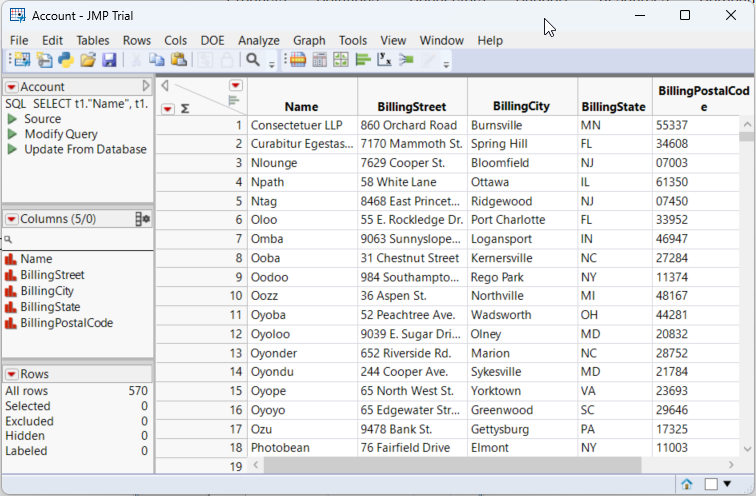
- Click Run Query to display the data.
![The results of a query in the Query Builder. (Salesforce is shown.)]()
- To refresh the results with the current data, right-click Update from Database and click Run Script.
Manipulate YouTube Analytics Data
You can execute data manipulation queries from JSL scripts such as the one below. To execute a script, click New Script in the toolbar. To connect, specify the DSN. You can then use the standard SQL syntax:
Open Database( "DSN=CData YouTubeAnalytics Source;",
"INSERT INTO Groups
(Mine)
VALUES ('True');");
Visualize YouTube Analytics Data
After importing, you can use the Graph Builder to create graphs visually. To open the Graph Builder, click the Graph Builder button in the toolbar.
- Drag a dimension column onto the x axis. For example, Snippet_Title.
- Drag a measure column onto the y axis. For example, ContentDetails_ItemCount.
- Select a chart type. For example, a bar chart.
![Configuration of a basic chart. (Salesforce is shown.)]()


