ノーコードでクラウド上のデータとの連携を実現。
詳細はこちら →SharePoint Excel Services Connector の30日間無償トライアルをダウンロード
30日間の無償トライアルへ製品の詳細
SharePoint Excel Services データ連携用のPython Connector ライブラリ。pandas、SQLAlchemy、Dash、petl などの主要なPython ツールにSharePoint Excel Services をシームレスに統合。
CData


こんにちは!ウェブ担当の加藤です。マーケ関連のデータ分析や整備もやっています。
Python エコシステムには多くのライブラリがあり、開発やデータ分析を行う際には必須と言っていいライブラリも多く存在します。CData Python Connector for ExcelServices は、pandas、Matplotlib、SQLAlchemy から使用することで SharePoint Excel Services にデータ連携するPython アプリケーションを構築したり、SharePoint Excel Services データの可視化を実現します。本記事では、pandas、SQLAlchemy、およびMatplotlib のビルトイン機能でSharePoint Excel Services にリアルタイムアクセスし、クエリを実行して結果を可視化する方法を説明します。
CData Python Connectors は、以下のような特徴を持った製品です。
CData Python Connectors では、1.データソースとしてSharePoint Excel Services の接続を設定、2.Python からPython Connectors との接続を設定、という2つのステップだけでデータソースに接続できます。以下に具体的な設定手順を説明します。
以下の手順に従い、必要なライブラリをインストールし、Python オブジェクト経由でSharePoint Excel Services にアクセスします。
pip で、pandas & Matplotlib ライブラリおよび、SQLAlchemy をインストールします。
pip install pandas
pip install matplotlib
pip install sqlalchemy
次にライブラリをインポートします。
import pandas
import matplotlib.pyplot as plt
from sqlalchemy import create_engine
次は接続文字列を作成してSharePoint Excel Services に接続します。create_engine 関数を使って、SharePoint Excel Services に連携するEngne を作成します。以下はサンプルの接続文字列になりますので、環境に応じてクレデンシャル部分を変更してください。
engine = create_engine("excelservices:///?URL=https://myorg.sharepoint.com&User=admin@myorg.onmicrosoft.com&Password=password&File=Book1.xlsx")
Authentication セクションのURL、User、およびPassword プロパティを、SharePoint Online、SharePoint 2010、SharePoint 2013 の有効なクレデンシャルに設定します。さらに、Library プロパティを有効なSharePoint Document ライブラリに設定し、File プロパティを指示されたライブラリの有効な.xlsx ファイルに設定する必要があります。
pandas のread_sql 関数を使って好きなSQL を発行して、DataFrame にデータを格納します。
df = pandas.read_sql("""SELECT Name, AnnualRevenue FROM Account WHERE Industry = 'Floppy Disks'""", engine)
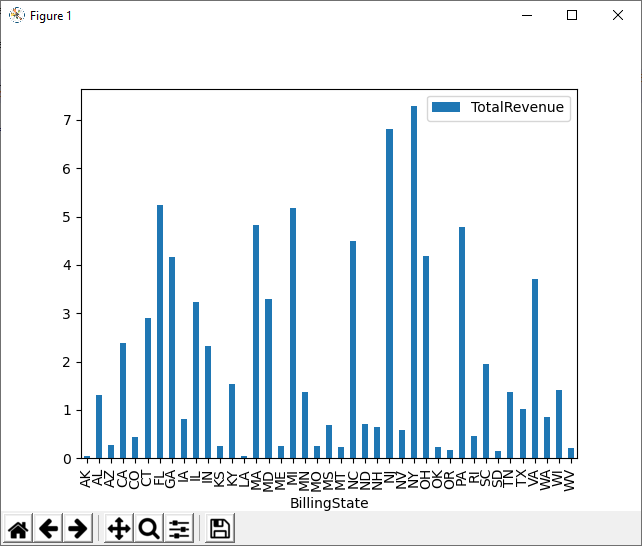
DataFrame に格納されたクエリ結果に対して、plot 関数をつかって、SharePoint Excel Services データをグラフ化してみます。
df.plot(kind="bar", x="Name", y="AnnualRevenue")
plt.show()
このようにCData Python Connector と併用することで、270を超えるSaaS、NoSQL データをPython からコーディングなしで扱うことができます。30日の無償評価版が利用できますので、ぜひ自社で使っているクラウドサービスやNoSQL と合わせて活用してみてください。
日本のユーザー向けにCData Python Connector は、UI の日本語化、ドキュメントの日本語化、日本語でのテクニカルサポートを提供しています。
import pandas
import matplotlib.pyplot as plt
from sqlalchemy import create_engin

engine = create_engine("excelservices:///?URL=https://myorg.sharepoint.com&User=admin@myorg.onmicrosoft.com&Password=password&File=Book1.xlsx")
df = pandas.read_sql("""SELECT Name, AnnualRevenue FROM Account WHERE Industry = 'Floppy Disks'""", engine)

df.plot(kind="bar", x="Name", y="AnnualRevenue")
plt.show()