各製品の資料を入手。
詳細はこちら →ADP Driver の30日間無償トライアルをダウンロード
30日間の無償トライアルへCData


こんにちは!ウェブ担当の加藤です。マーケ関連のデータ分析や整備もやっています。
Crystal Reports には、JDBC 標準向けのサポートが組み込まれています。この記事では、ADP の機能を持つ帳票を作成するレポート作成ウィザードの使い方を説明します。
CData JDBC Driver for ADP を、ドライバーのJAR をCrystal Reports のクラスパスに含めてインストール:DataDriverCommonElement の下のClassPath element のパスに、 .jar を含むファイルのフルパスを追加します。
CRConfig.xml は通常C:\Program Files (x86)\SAP BusinessObjects\SAP BusinessObjects Enterprise XI 4.0\java に配置されます。— パスはインストールによって若干異なる場合があります。ドライバーのJAR はインストールディレクトリの[lib]サブフォルダ内にあります。
ClassPath にJAR を追加したら、Crystal Reports を再起動します。
下記の手順に従って、レポート作成ウィザードを使ってADP 接続を作成します。
ウィザードでJDBC 接続URL を選択します。
jdbc:adp:OAuthClientId=YourClientId;OAuthClientSecret=YourClientSecret;SSLClientCert='c:\cert.pfx';SSLClientCertPassword='admin@123'
ドライバーのクラス名を設定:
cdata.jdbc.adp.ADPDriver
接続を確立する前に、ADP に連絡してOAuth アプリとそれに関連するクレデンシャルを提供してもらう必要があります。 これらのクレデンシャルはADP からのみ取得が可能で、直接取得することはできません。
次のプロパティを指定してADP に接続します。
JDBC 接続をADP に追加したら、レポート作成ウィザードを使ってADP を帳票に追加できます。
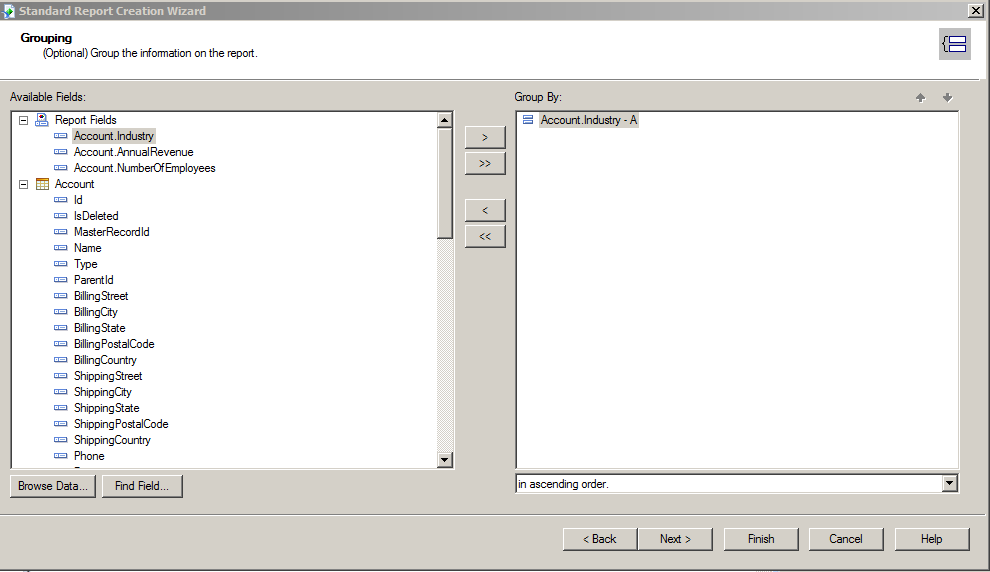
帳票に必要なテーブルやフィールドを選択して、データソースを設定します。この例では、Workers テーブルのAssociateOID およびWorkerID カラムを使います。
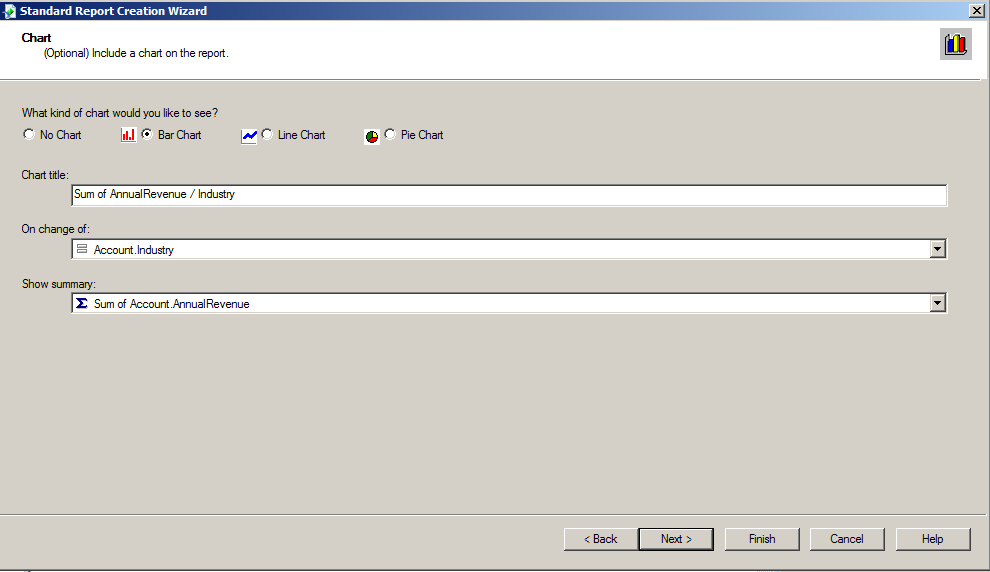
チャートの種類を設定 ウィザードを完了すると、Crystal Reports はADP データ に実行されるSQL クエリをビルドします。ドライバーは、ライブADP データ に対してクエリを実行します。
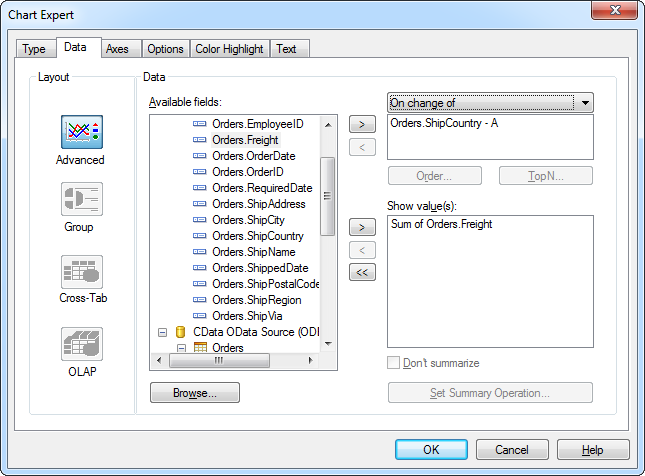
データのインポートが終わったら、データをサマライズもしくはソートするチャートやレポートオブジェクトを作成できます。[Insert]>[Chart]をクリックして、チャートエキスパートを開きます。Total WorkerID by AssociateOID を表すグラフを作成するには、AssociateOID を[On Change Of]メニューセレクションの下のボックスに追加してからWorkerID を[Show Values]の下のボックスに追加します。
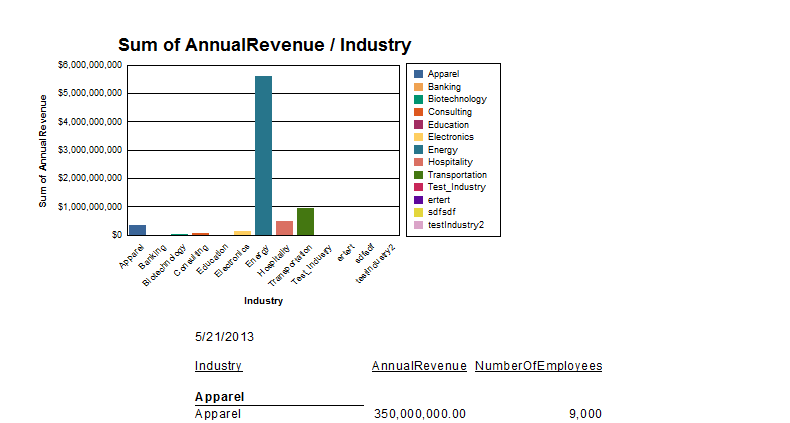
完成した帳票をプレビューして、チャートにデータが入っていることを確認します。Null 値を取り除きたい場合は、SelectionFormula を使います。