JReport Designer でCertinia データを連携

JReport Designer でCertinia に連携するチャートとレポートを作成します。

加藤龍彦
ウェブデベロッパー


certinia ロゴ

CData

jdbc ロゴ画像
JReport Designer ロゴ

こんにちは!ウェブ担当の加藤です。マーケ関連のデータ分析や整備もやっています。

CData JDBC Driver for Certinia を使用すると、Certinia がリレーショナルデータベースであるかのようにダッシュボードやレポートからリアルタイムデータにアクセスでき、使い慣れたSQL クエリを使用してCertinia] をクエリできます。ここでは、JDBC データソースとしてCertinia に連携し、JReport Designer でCertinia のレポートを作成する方法を説明します。

Certinia データに接続

  1. C:\JReport\Designer\bin\setenv.bat を編集し、JAR ファイルの場所をADDCLASSPATH 変数に追加します。
    ...
    set ADDCLASSPATH=%JAVAHOME%\lib\tools.jar;C:\Program Files\CData\CData JDBC Driver for Certinia 2016\lib\cdata.jdbc.certinia.jar;
    ...
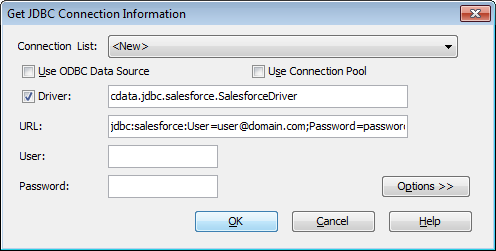
    
  2. [File][New][Data Source]と進み、新しいデータソースを作成します。
  3. 表示されるダイアログで、データソースの名前(CData JDBC Driver for Certinia) を作成し、JDBC を選択して[OK]をクリックします。
  4. [JDBC Connection Information]ダイアログで、JDBC ドライバーへの接続を構成します。
    • Driver:[Driver]ボックスにチェックがついていることを確認し、ドライバーのクラスの名前を入力します。 cdata.jdbc.certinia.CertiniaDriver
    • URL:jdbc:certinia: から始まり、その後にセミコロンで区切られた接続プロパティのリストが続くJDBC URL を入力します。

      There are several authentication methods available for connecting to Certinia: login credentials, SSO, and OAuth.

      Authenticating with a Login and Token

      Set the User and Password to your login credentials. Additionally, set the SecurityToken. By default, the SecurityToken is required, but you can make it optional by allowing a range of trusted IP addresses.

      To disable the security token:

      1. Log in to Certinia and enter "Network Access" in the Quick Find box in the setup section.
      2. Add your IP address to the list of trusted IP addresses.

      To obtain the security token:

      1. Open the personal information page on Certinia.com.
      2. Click the link to reset your security token. The token will be emailed to you.
      3. Specify the security token in the SecurityToken connection property or append it to the Password.

      Authenticating with OAuth

      If you do not have access to the user name and password or do not want to require them, use the OAuth user consent flow. See the OAuth section in the Help for an authentication guide.

      Connecting to Certinia Sandbox Accounts

      Set UseSandbox to true (false by default) to use a Certinia sandbox account. Ensure that you specify a sandbox user name in User.

      ビルトイン接続文字列デザイナー

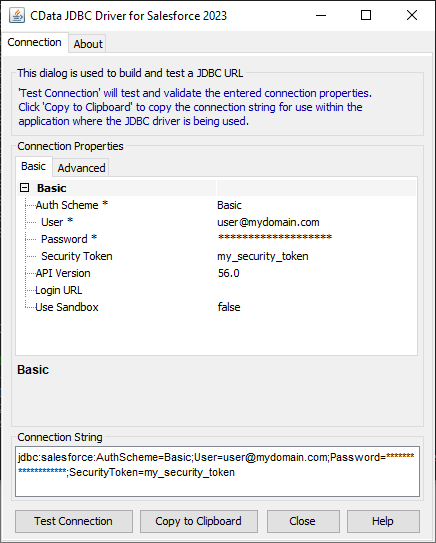
      JDBC URL の構成については、Certinia JDBC Driver に組み込まれている接続文字列デザイナーを使用してください。JAR ファイルのダブルクリック、またはコマンドラインからJAR ファイルを実行します。

      java -jar cdata.jdbc.certinia.jar

      接続プロパティを入力し、接続文字列をクリップボードにコピーします。

      Using the built-in connection string designer to generate a JDBC URL (Salesforce is shown.)

      JDBC URL を構成する際、Max Rows 接続プロパティを設定することもできます。これによって戻される行数を制限するため、可視化・レポートのデザイン設計時のパフォーマンスを向上させるのに役立ちます。

      以下は一般的なJDBC URLです。

      jdbc:certinia:User=myUser;Password=myPassword;Security Token=myToken;InitiateOAuth=GETANDREFRESH
    • User:認証に使用するユーザー名は、通常空白のままにします。
    • Password:User と同様に認証に使用するパスワードも、通常は空白のままにします。
    Configuring the connection to the JDBC Driver (Salesforce is shown.)
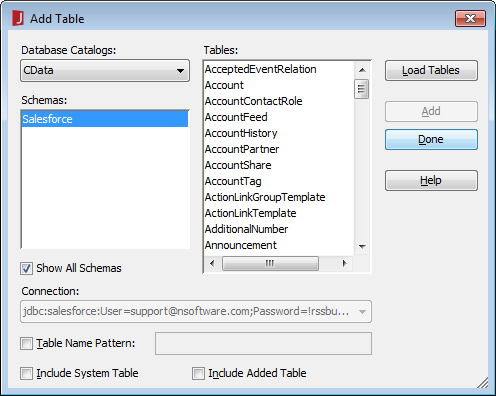
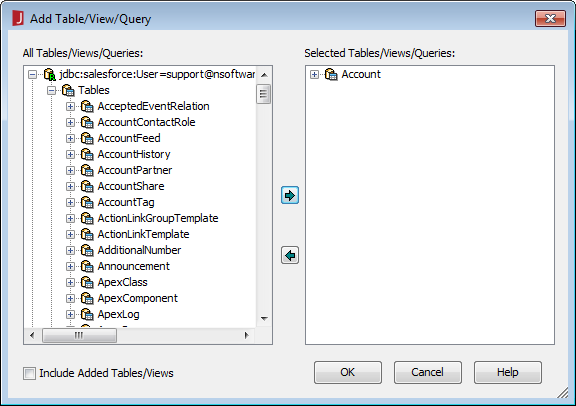
  5. [Add Table]ダイアログで、レポート(またはこのデータソースを使用する予定のレポート)に含めるテーブルを選択し、[Add]をクリックします。

    Adding Tables.(Salesforce is shown.)

    ダイアログがテーブルのロードを完了したら、[Done]をクリックします。

  6. [Catalog Browser]では、レポートの作成に使用するクエリを作成できます。今すぐ、またはレポートの作成後に作成できますが、どちらにしても、 データソース(CData JDBC Driver for Certinia) を展開()し、[Queries]を右クリックして[Add Query]を選択します。 Adding a query for data to be used in the report.(Salesforce is shown.)
  7. [Add Table/View/Query]ダイアログで、JDBC URL とTables を展開() し、クエリで使用するテーブルを選択して[OK]をクリックします。 Selecting a table for the query.(Salesforce is shown.)
  8. [Query Editor]ダイアログで、含めるカラムを選択するか、[SQL]ボタンをクリックして以下のようにカスタムクエリを手動で入力できます。
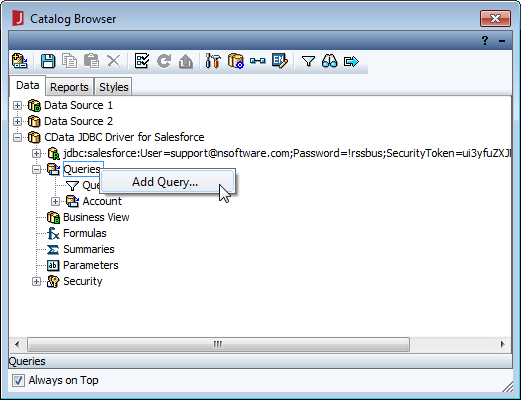
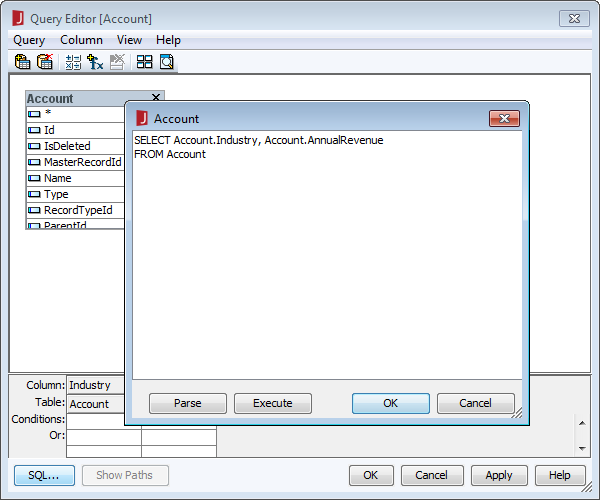
    SELECT BillingState, Name FROM Account WHERE Industry = 'Floppy Disks'
    
    Editing the query.(Salesforce is shown.)

    クエリが作成されたら、[OK]をクリックして[Query Editor]ダイアログを閉じます。この時点で、Certinia を新規または既存のレポートに追加する準備が整いました。

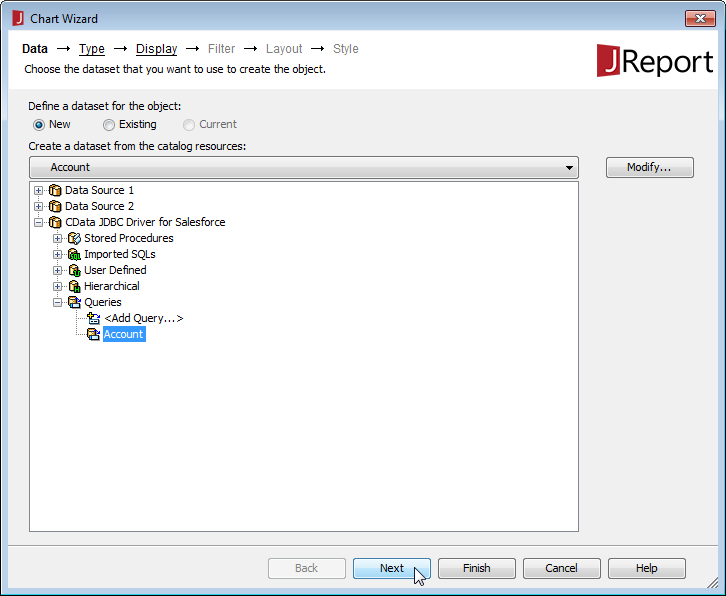
    NOTE: クエリが作成されると、クエリに基づいて[Business View]を作成できます。[Business View]を使用すると、クエリに基づいてWeb レポートまたはライブラリコンポーネントを作成できます。これについてのより詳しい情報は、JReport のチュートリアルを参照してください。

レポートにCertinia データを追加

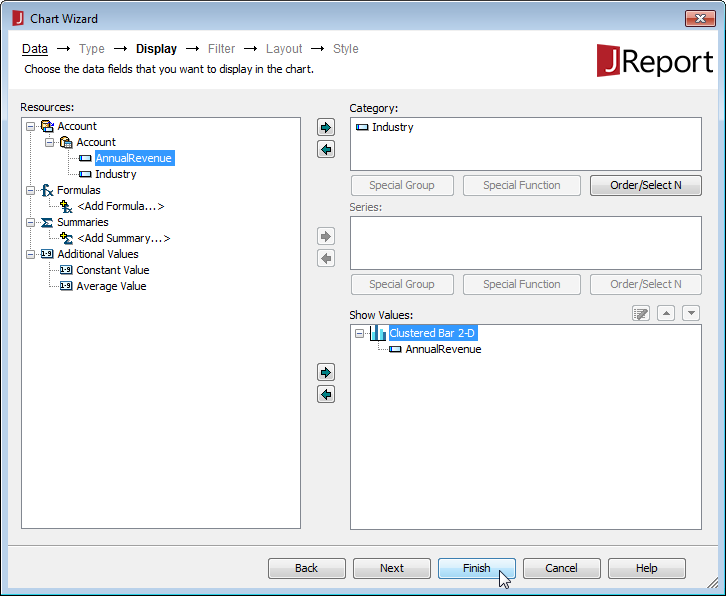
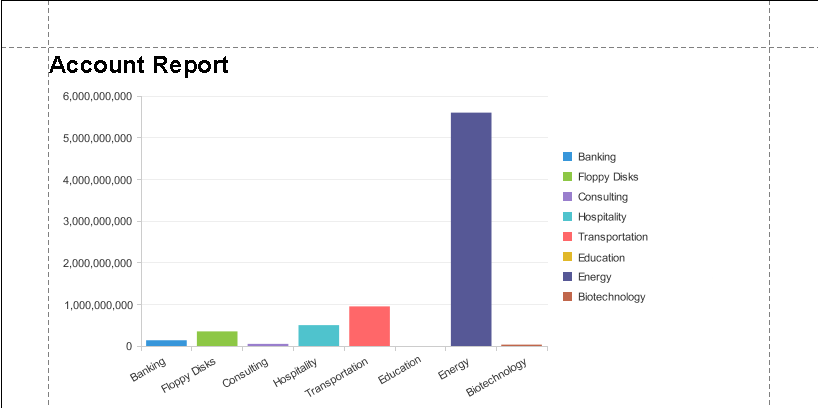
Certinia を使用してレポートを作成することができるようになりました。

  1. 新しいレポートを作成([File][New][Page Report]) するか、既存のレポートの[Chart Wizard]を開きます。
  2. クエリを選択(または上記を参照して新しいクエリを作成) します。
  3. Selecting the query to use.(Salesforce is shown.)
  4. クエリのカラムからグラフの[Category]と[Value]を割り当て、[Finish]をクリックします。
  5. Assigning columns to define the chart.(Salesforce is shown.)
  6. レポートの[View]タブをクリックし、チャートを表示します。
Sample chart based on live data.(Salesforce is shown.)

関連コンテンツ

トライアル・お問い合わせ

30日間無償トライアルで、CData のリアルタイムデータ連携をフルにお試しいただけます。記事や製品についてのご質問があればお気軽にお問い合わせください。