各製品の資料を入手。
詳細はこちら →Marketo Data Provider の30日間無償トライアルをダウンロード
30日間の無償トライアルへ製品の詳細
Marketo マーケティング自動化データ(潜在顧客、営業案件、チャンネル、キャンペーンなど)を組み込んだパワフルな.NET アプリケーションを短時間・低コストで作成して配布できます。
CData


こんにちは!ウェブ担当の加藤です。マーケ関連のデータ分析や整備もやっています。
Marketo 用の CData ADO.NET プロバイダーはサードパーティーコントロールで使うことのできる通常のADO.NET データベースアクセスコンポーネントを実装しています。データバインドするための通常のADO.NET プロセスに従うことで、UI コントロールから実データへの双方向アクセスを可能にします。 この記事では、CData を使ってDevExpress Windows Forms とウェブコントロールにデータバインドする方法を説明します。ここでは、最新のデータを表示するチャートにデータバインドします。
REST インターフェースでのMarketo への接続をサポートしています。Schema プロパティで「REST」を選択してください。
OAuth とREST セクションでOAuthClientId、OAuthClientSecret、RESTEndpoint プロパティを設定します。
詳細はヘルプドキュメントの「はじめに」を参照してください。
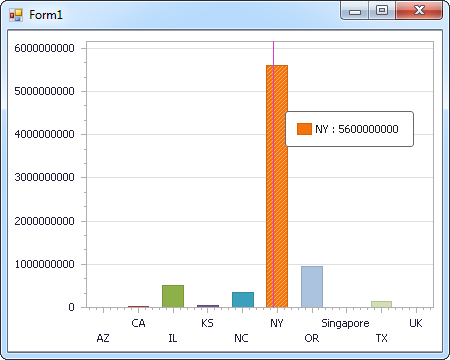
下のコードでは、Marketo でDevExpress のチャートに追加する方法を説明します。MarketoDataAdapter はチャートコントロールのSeries プロパティにバインドします。コントロールのDiagram プロパティはx 軸とy 軸をカラム名として定義します。
using (MarketoConnection connection = new MarketoConnection(
"Schema=REST;RESTEndpoint=https://311-IFS-929.mktorest.com/rest;OAuthClientId=MyOAuthClientId;OAuthClientSecret=MyOAuthClientSecret;")) {
  MarketoDataAdapter dataAdapter = new MarketoDataAdapter(
  "SELECT Email, AnnualRevenue FROM Leads", connection);

  DataTable table = new DataTable();
  dataAdapter.Fill(table);
  DevExpress.XtraCharts.Series series = new DevExpress.XtraCharts.Series();
  chartControl1.Series.Add(series);
  DataTable table = new DataTable();
  series.ValueDataMembers.AddRange(new string[] { "AnnualRevenue" });
  series.ArgumentScaleType = DevExpress.XtraCharts.ScaleType.Qualitative;
  series.ArgumentDataMember = "Email";
  series.ValueScaleType = DevExpress.XtraCharts.ScaleType.Numerical;
  chartControl1.Legend.Visibility = DevExpress.Utils.DefaultBoolean.False;
  ((DevExpress.XtraCharts.SideBySideBarSeriesView)series.View).ColorEach = true;
}
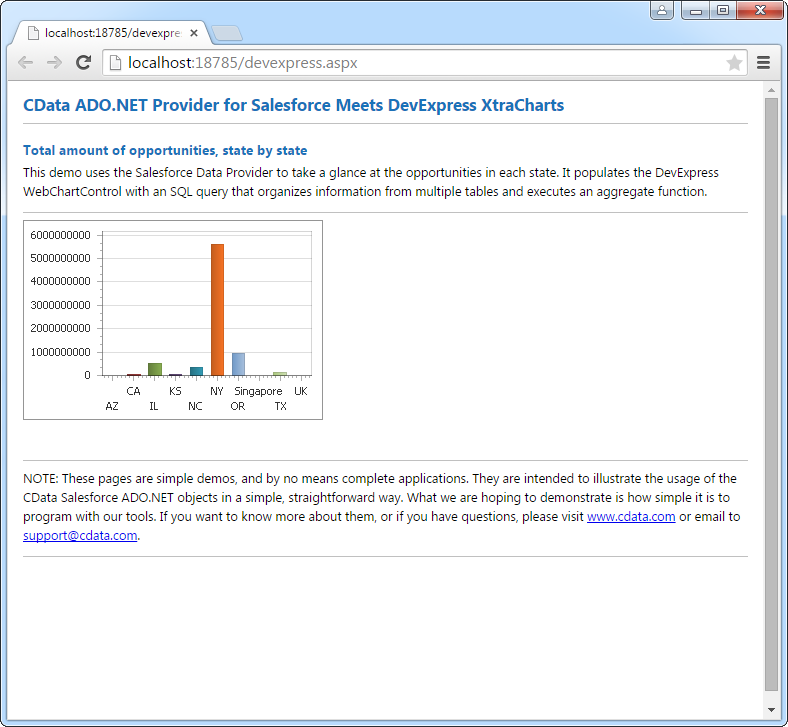
下のコードではMarketo でDevExpress Web を操作するための設定方法を説明します。MarketoDataAdapter はチャートのSeries プロパティにバインドします。Diagram プロパティはx 軸とy 軸をカラム名として定義します。
using DevExpress.XtraCharts;

using (MarketoConnection connection = new MarketoConnection(
"Schema=REST;RESTEndpoint=https://311-IFS-929.mktorest.com/rest;OAuthClientId=MyOAuthClientId;OAuthClientSecret=MyOAuthClientSecret;"))
{
  MarketoDataAdapter MarketoDataAdapter1 = new MarketoDataAdapter("SELECT Email, AnnualRevenue FROM Leads", connection);
  DataTable table = new DataTable();
  MarketoDataAdapter1.Fill(table);
  DevExpress.XtraCharts.Series series = new Series("Series1", ViewType.Bar);
  WebChartControl1.Series.Add(series);
  DataTable table = new DataTable();
  series.ValueDataMembers.AddRange(new string[] { "AnnualRevenue" });
  series.ArgumentScaleType = ScaleType.Qualitative;
  series.ArgumentDataMember = "Email";
  series.ValueScaleType = ScaleType.Numerical;
  ((DevExpress.XtraCharts.SideBySideBarSeriesView)series.View).ColorEach = true;
}