Discover how a bimodal integration strategy can address the major data management challenges facing your organization today.
Get the Report →


Create Data Visualizations in Tableau with Google Spreadsheets data
The CData ODBC Drivers enable you to view your Google spreadsheets in Tableau as an ODBC data source. It automatically creates data types for your spreadsheet fields, which enables you to use them with the visual style of working with data in Tableau.
You can follow the procedure below to connect to the Google Spreadsheets data source in Tableau. This article begins with connecting to an ODBC data source that has already been configured. We show the necessary steps to create a new ODBC data source in the Getting Started section of our Help documentation.
- In a new project in Tableau, click Connect to Data -> Other Databases (ODBC). Select the CData Domain Source Name (DSN); the CData driver supports both 64- and 32-bit applications.
![]()
![]()
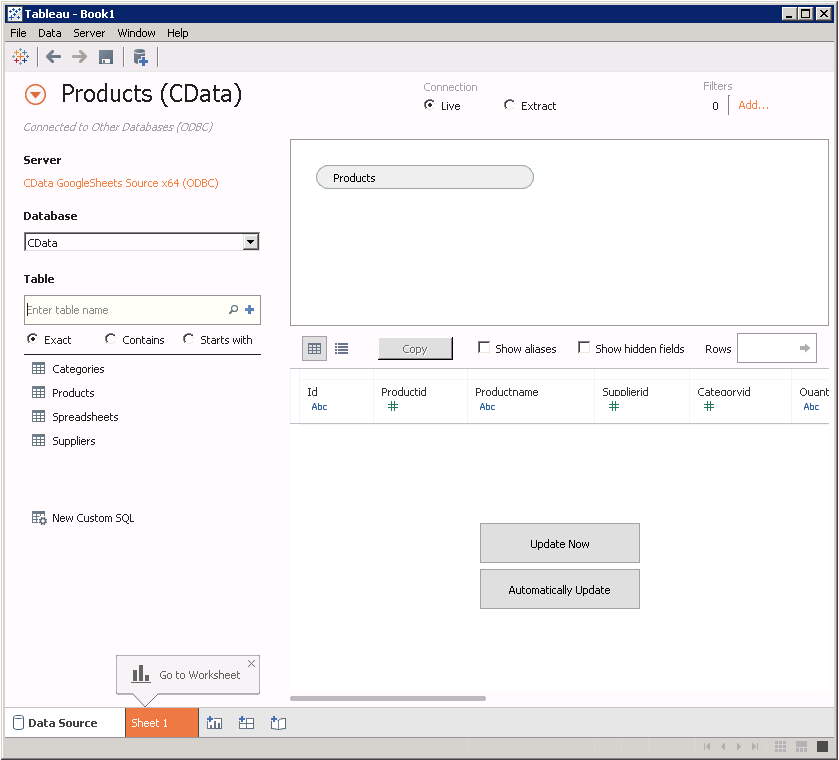
- Select Single Table and click the Find icon to select the table you want to visualize.
![]()
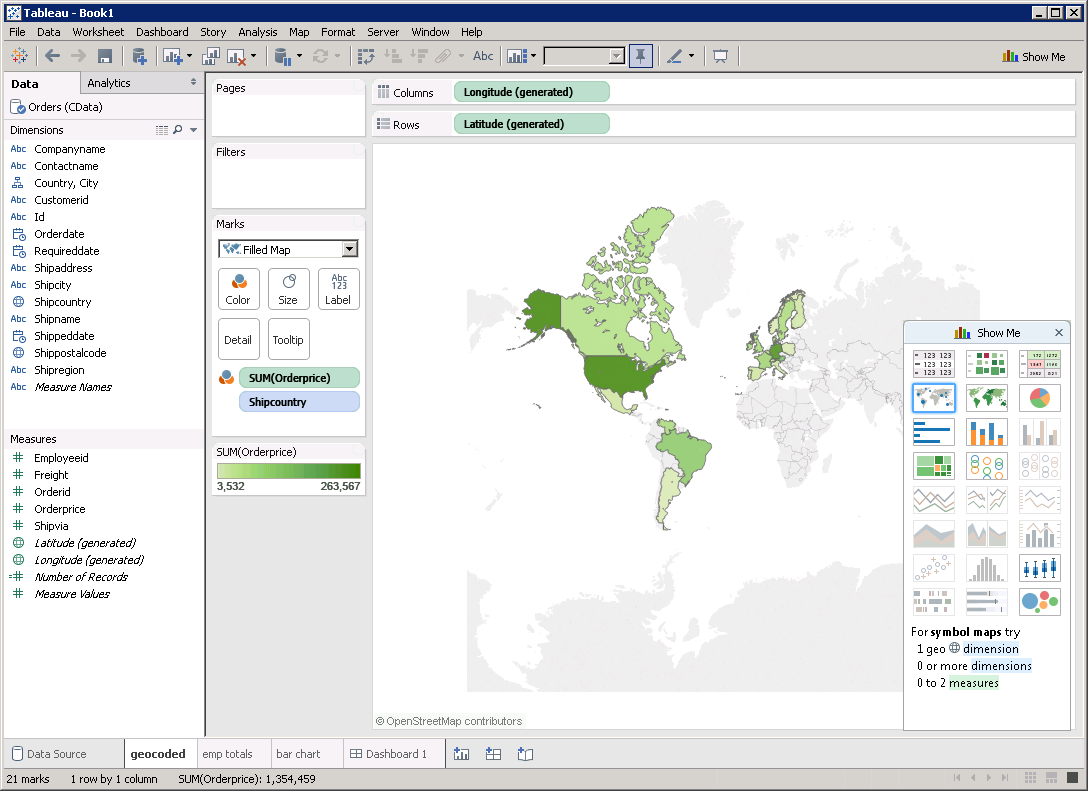
- Drop a field in the Dimensions pane onto the dashboard. Tableau will calculate the list of available map types based on the data type of the column.
![]()
- Drag a field in the Measures field onto the Detail and Color buttons, resulting in a heat map.
![]()
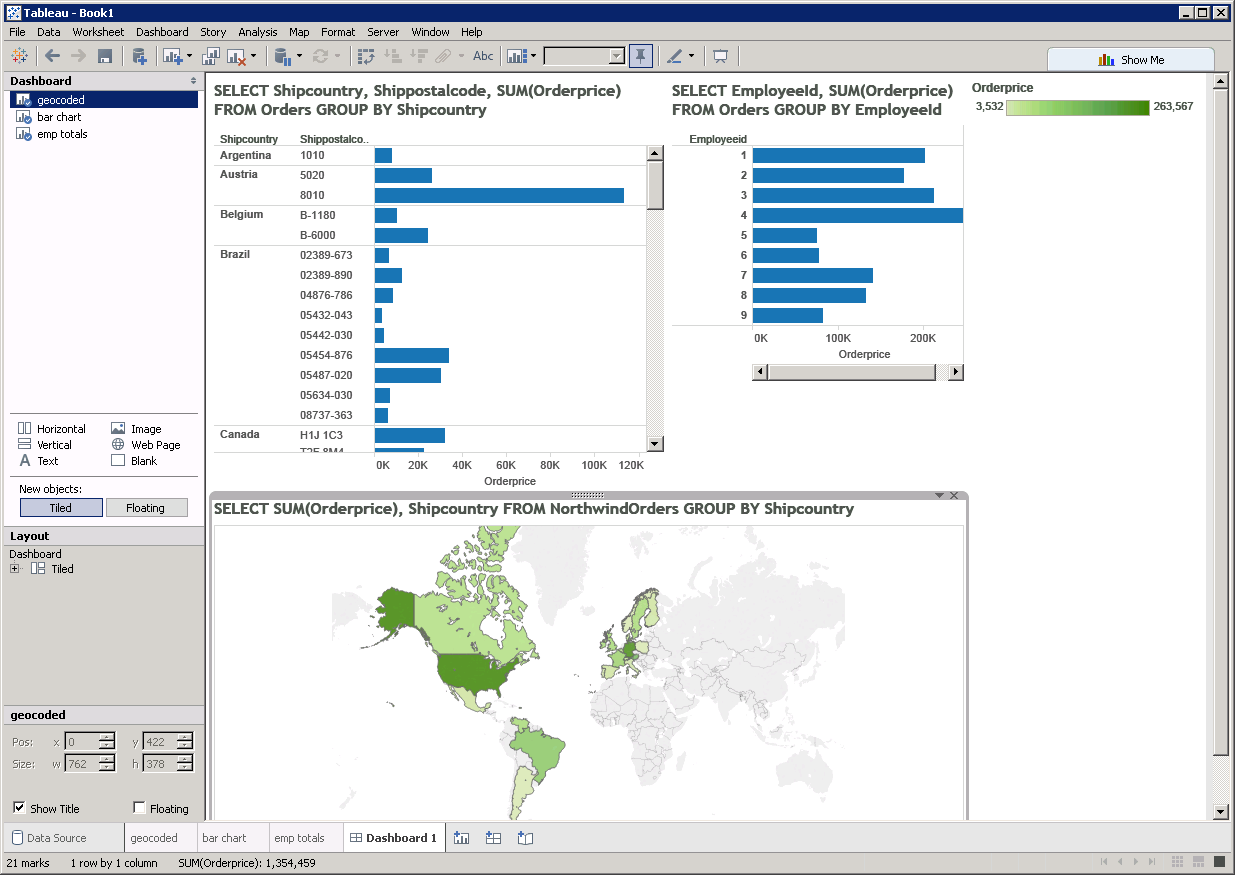
- Create other charts using dimensions and measures to build SQL queries visually. The provider's automatic support for data types gives you instant access to the logical layout of your spreadsheets in Tableau:
![]()


Data Connectors
ETL/ ELT Solutions
Cloud & API Connectivity
OEM & Custom Drivers