Discover how a bimodal integration strategy can address the major data management challenges facing your organization today.
Get the Report →Integrate Jira Service Management Data in the Pentaho Report Designer
Publish reports based on Jira Service Management data in the Pentaho BI tool.
The CData JDBC Driver for Jira Service Management data enables access to live data from dashboards and reports. This article shows how to connect to Jira Service Management data as a JDBC data source and publish reports based on Jira Service Management data in Pentaho.
Connect and Create a Report
- Copy the JAR file of the driver, located in the lib subfolder of the installation directory, to the \Report-Designer\lib\jdbc\ folder in the Pentaho directory.
- Run the report-designer.bat file in the \Report-Designer\ folder to open the Report-Designer UI.
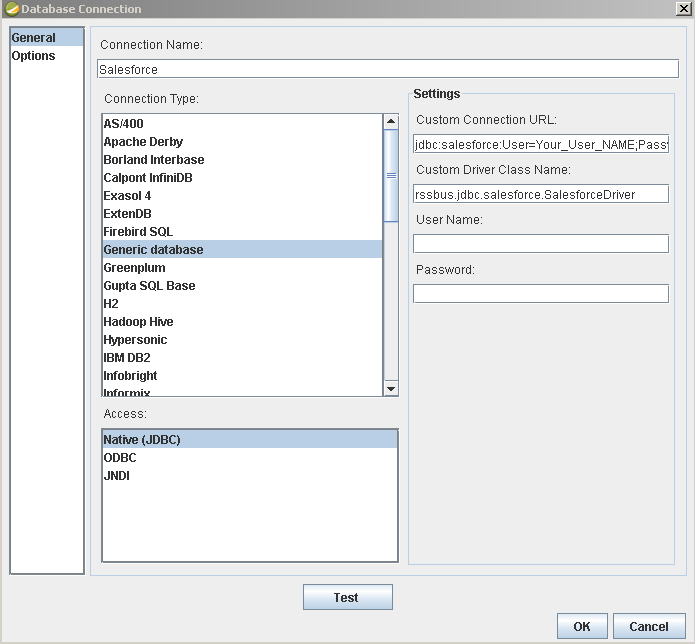
Create a new data source with the driver by clicking Data -> Add Data Source -> Advanced -> JDBC (Custom) and then creating a new Jira Service Management connection. In the resulting dialog, configure the connection properties as shown below.
Custom Connection URL property: Enter the JDBC URL. This starts with jdbc:jiraservicedesk: and is followed by a semicolon-separated list of connection properties.
You can establish a connection to any Jira Service Desk Cloud account or Server instance.
Connecting with a Cloud Account
To connect to a Cloud account, you'll first need to retrieve an APIToken. To generate one, log in to your Atlassian account and navigate to API tokens > Create API token. The generated token will be displayed.
Supply the following to connect to data:
- User: Set this to the username of the authenticating user.
- APIToken: Set this to the API token found previously.
Connecting with a Service Account
To authenticate with a service account, you will need to supply the following connection properties:
- User: Set this to the username of the authenticating user.
- Password: Set this to the password of the authenticating user.
- URL: Set this to the URL associated with your JIRA Service Desk endpoint. For example, https://yoursitename.atlassian.net.
Note: Password has been deprecated for connecting to a Cloud Account and is now used only to connect to a Server Instance.
Accessing Custom Fields
By default, the connector only surfaces system fields. To access the custom fields for Issues, set IncludeCustomFields.
Built-in Connection String Designer
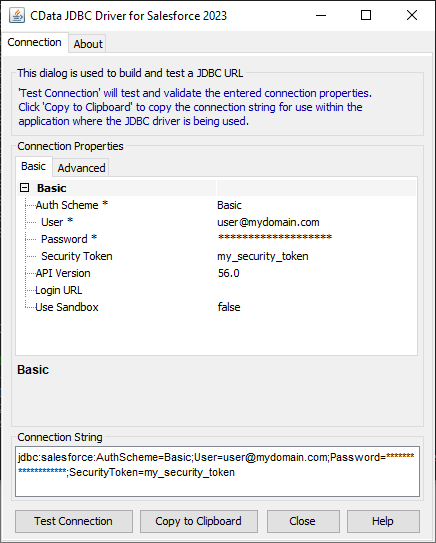
For assistance in constructing the JDBC URL, use the connection string designer built into the Jira Service Management JDBC Driver. Either double-click the JAR file or execute the jar file from the command-line.
java -jar cdata.jdbc.jiraservicedesk.jarFill in the connection properties and copy the connection string to the clipboard.
![Using the built-in connection string designer to generate a JDBC URL (Salesforce is shown.)]()
When you configure the JDBC URL, you may also want to set the Max Rows connection property. This will limit the number of rows returned, which is especially helpful for improving performance when designing reports and visualizations.
Below is a typical JDBC URL:
jdbc:jiraservicedesk:ApiKey=myApiKey;User=MyUser;InitiateOAuth=GETANDREFRESH- Custom Driver Class Name: Enter cdata.jdbc.jiraservicedesk.JiraServiceDeskDriver.
- User Name: The username to authenticate with.
- Password: The password to authenticate with.
![Required connection properties defined in the JDBC URL. (Salesforce is shown.)]()
Add Jira Service Management Data to a Report
You are now ready to create a report with Jira Service Management data.
-
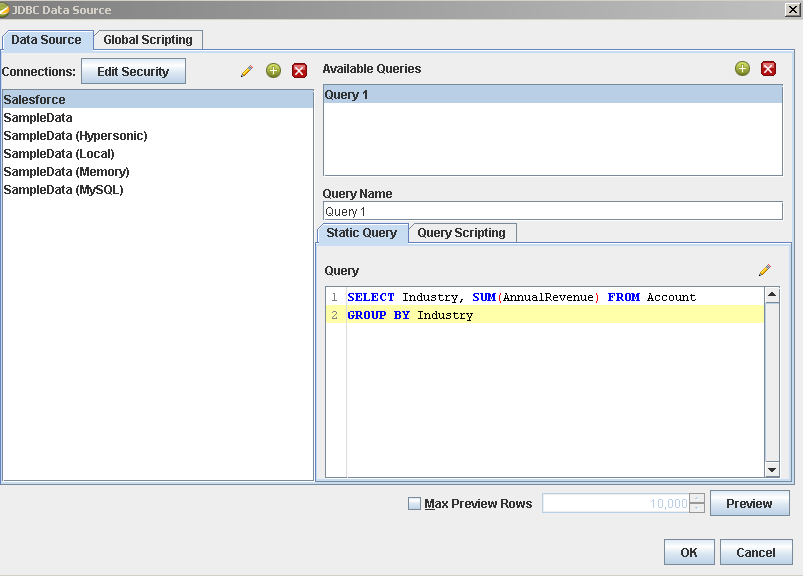
Add the Jira Service Management source to your report: Click Data -> Add Data Source -> JDBC and select the data source.
Configure the query. This article uses the one below:
SELECT RequestId, ReporterName FROM Requests WHERE CurrentStatus = 'Open'![The query to retrieve data, specified in the JDBC data source configuration wizard. (Salesforce is shown.)]()
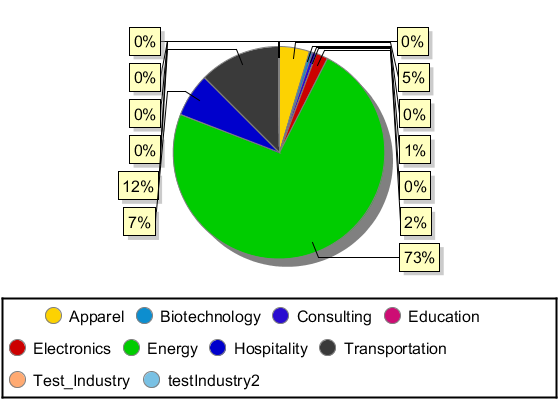
- Drag a chart onto your report and double-click it to edit the chart. Run the report to display the chart. You can use the results of this query to create a simple chart for the Requests table.
- Finally, run the report to see the chart.
