Discover how a bimodal integration strategy can address the major data management challenges facing your organization today.
Get the Report →How to create Visio diagrams from JSON Services
Automatically update JSON services with the changes you make to Visio master shapes.
Automate the process of entering data into Visio diagrams and keeping your diagrams up to date with the CData ODBC Driver for JSON. The driver surfaces JSON services as an ODBC data source that can be accessed by applications with built-in ODBC support like Microsoft Office. This article shows how to create a simple diagram to start brainstorming about Visio projects linked to JSON services.
Connect to JSON as an ODBC Data Source
If you have not already, first specify connection properties in an ODBC DSN (data source name). This is the last step of the driver installation. You can use the Microsoft ODBC Data Source Administrator to create and configure ODBC DSNs.
See the Getting Started chapter in the data provider documentation to authenticate to your data source: The data provider models JSON APIs as bidirectional database tables and JSON files as read-only views (local files, files stored on popular cloud services, and FTP servers). The major authentication schemes are supported, including HTTP Basic, Digest, NTLM, OAuth, and FTP. See the Getting Started chapter in the data provider documentation for authentication guides.
After setting the URI and providing any authentication values, set DataModel to more closely match the data representation to the structure of your data.
The DataModel property is the controlling property over how your data is represented into tables and toggles the following basic configurations.
- Document (default): Model a top-level, document view of your JSON data. The data provider returns nested elements as aggregates of data.
- FlattenedDocuments: Implicitly join nested documents and their parents into a single table.
- Relational: Return individual, related tables from hierarchical data. The tables contain a primary key and a foreign key that links to the parent document.
See the Modeling JSON Data chapter for more information on configuring the relational representation. You will also find the sample data used in the following examples. The data includes entries for people, the cars they own, and various maintenance services performed on those cars.
Connect JSON Services to Diagrams
Follow the steps below to use the Data Selector Wizard to import data into your diagram.
- Open Visio and click File -> New. Open the Brainstorming template.
- On the Data tab, click Link Data to Shapes.
- Select the ODBC option and select ODBC DSN.
- Select the DSN for JSON, select the table you want to import, and finish the wizard. This article uses people as an example.
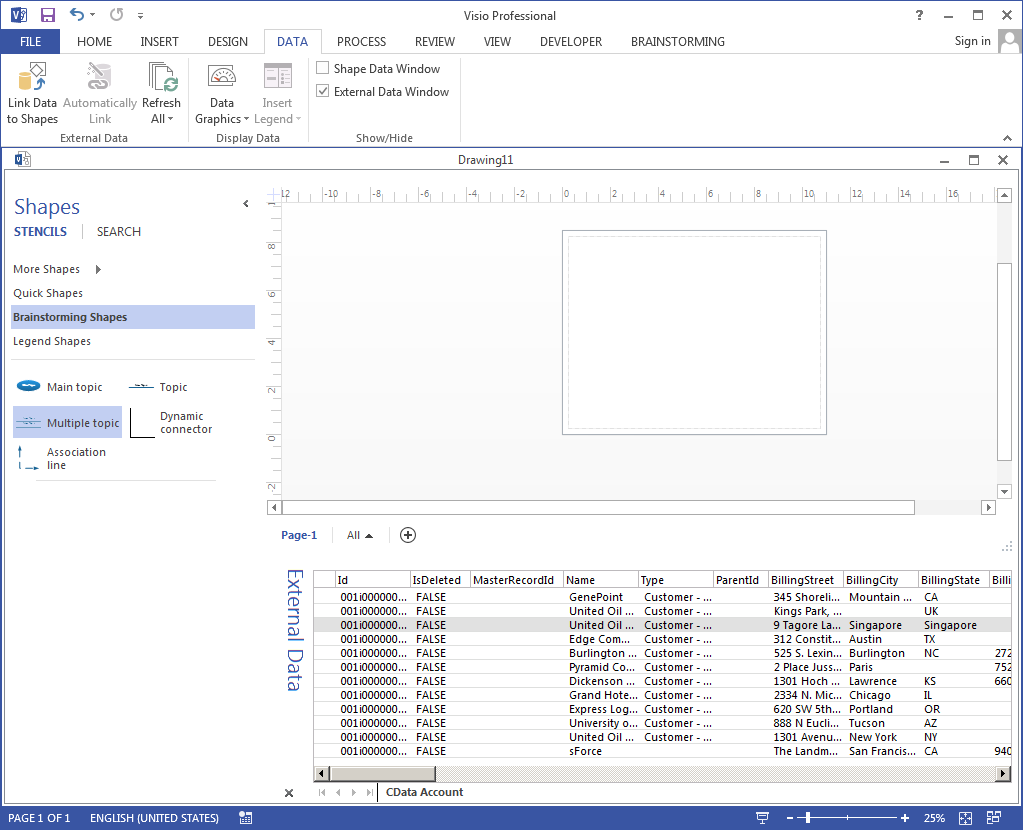
Link JSON Entities to Shapes
Follow the steps below to create a simple diagram that shows how to create shapes from your data, one of the ways to link JSON entities to shapes:
- Click Brainstorming Shapes and drag a main topic onto the drawing page. Enter people as the text of the main topic.
- Click Topic.
- Select a row in the External Data window and drag it onto the drawing page.
- Right-click the Topic shape and click Data -> Edit Data Graphic.
- Click New Item.
- In the Data Field menu, select a column. In the Displayed As menu, select how to display them.
![A data graphic for a column.]()
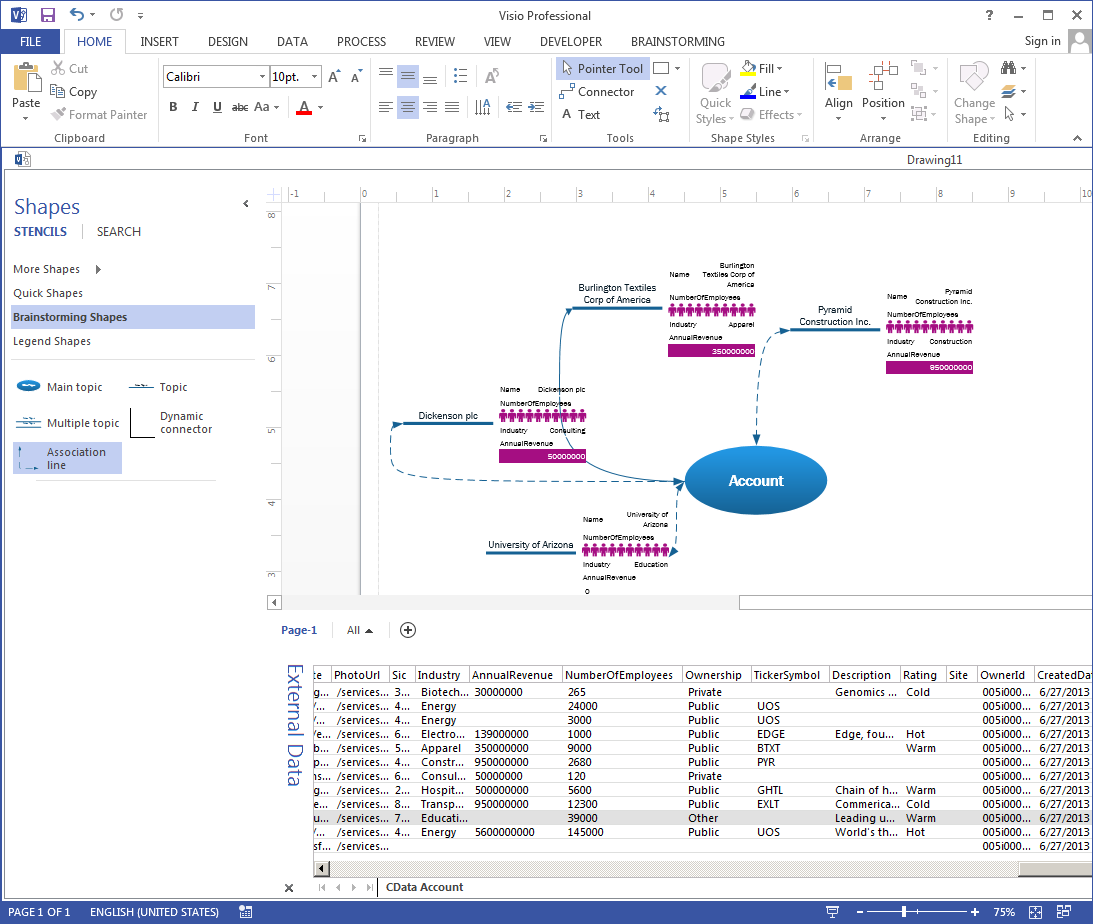
- Drag a few other JSON entities onto the drawing page and add association lines back to the main topic, people. New topics have the same configuration: Numeric columns displayed in data bars stand out in contrast to other people entities.
![Brainstorming with external data. (Salesforce is shown.)]()
You can refresh your diagram from the Data tab, synchronizing your shapes with the external JSON services.

