Discover how a bimodal integration strategy can address the major data management challenges facing your organization today.
Get the Report →DataBind MySQL Data to the DevExpress Data Grid
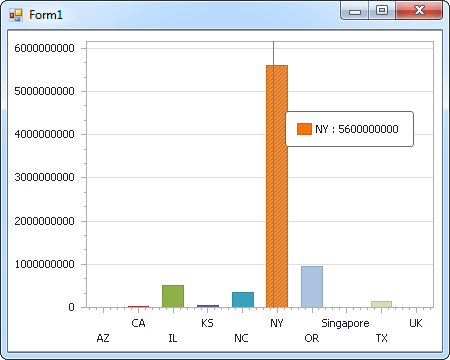
Use the CData ADO.NET Provider for MySQL with the DevExpress Windows Forms and Web controls to provide MySQL data to a chart.
The ADO.NET Provider for MySQL by CData incorporates conventional ADO.NET data access components compatible with third-party controls. You can adhere to the standard ADO.NET data binding procedures to establish two-way access to real-time data through UI controls. This article will demonstrate the utilization of CData components for data binding with DevExpress UI Controls (Windows Forms and Web controls), specifically binding to a chart that visualizes live data.
The Server and Port properties must be set to a MySQL server. If IntegratedSecurity is set to false, then User and Password must be set to valid user credentials. Optionally, Database can be set to connect to a specific database. If not set, tables from all databases will be returned.
Windows Forms Controls
The code below shows how to populate a DevExpress chart with MySQL data. The MySQLDataAdapter binds to the Series property of the chart control. The Diagram property of the control defines the x- and y-axes as the column names.
using (MySQLConnection connection = new MySQLConnection(
"User=myUser;Password=myPassword;Database=NorthWind;Server=myServer;Port=3306;")) {
  MySQLDataAdapter dataAdapter = new MySQLDataAdapter(
  "SELECT ShipName, Freight FROM Orders", connection);

  DataTable table = new DataTable();
  dataAdapter.Fill(table);
  DevExpress.XtraCharts.Series series = new DevExpress.XtraCharts.Series();
  chartControl1.Series.Add(series);
  series.DataSource = table;
  series.ValueDataMembers.AddRange(new string[] { "Freight" });
  series.ArgumentScaleType = DevExpress.XtraCharts.ScaleType.Qualitative;
  series.ArgumentDataMember = "ShipName";
  series.ValueScaleType = DevExpress.XtraCharts.ScaleType.Numerical;
  chartControl1.Legend.Visibility = DevExpress.Utils.DefaultBoolean.False;
  ((DevExpress.XtraCharts.SideBySideBarSeriesView)series.View).ColorEach = true;
}

Web Controls
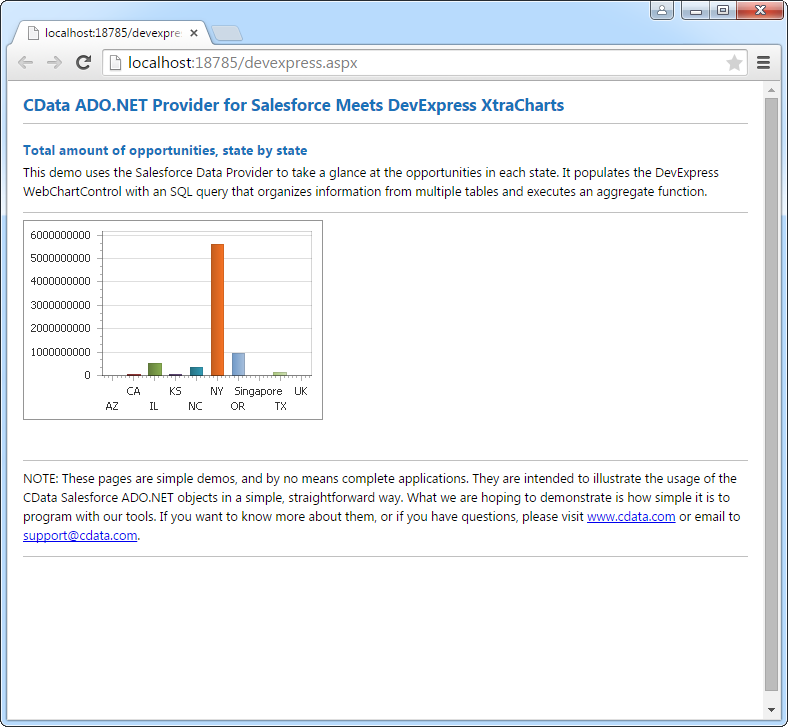
The code below shows how to populate a DevExpress Web control with MySQL data. The MySQLDataAdapter binds to the Series property of the chart; the Diagram property defines the x- and y-axes as the column names.
using DevExpress.XtraCharts;

using (MySQLConnection connection = new MySQLConnection(
"User=myUser;Password=myPassword;Database=NorthWind;Server=myServer;Port=3306;"))
{
  MySQLDataAdapter MySQLDataAdapter1 = new MySQLDataAdapter("SELECT ShipName, Freight FROM Orders", connection);
  DataTable table = new DataTable();
  MySQLDataAdapter1.Fill(table);
  DevExpress.XtraCharts.Series series = new Series("Series1", ViewType.Bar);
  WebChartControl1.Series.Add(series);
  series.DataSource = table;
  series.ValueDataMembers.AddRange(new string[] { "Freight" });
  series.ArgumentScaleType = ScaleType.Qualitative;
  series.ArgumentDataMember = "ShipName";
  series.ValueScaleType = ScaleType.Numerical;
  ((DevExpress.XtraCharts.SideBySideBarSeriesView)series.View).ColorEach = true;
}


