Discover how a bimodal integration strategy can address the major data management challenges facing your organization today.
Get the Report →Build REST-Connected Dashboards in Redash
Use CData Connect Server to create a virtual SQL Server Database for REST data and build visualizations and dashbaords from REST data in Redash.
Redash lets you connect and query your data sources, build dashboards to visualize data and share them with your company. When paired with CData Connect Server, you get instant, cloud-to-cloud access to REST data for visualizations, dashboards, and more. This article shows how to create a virtual database for REST and build visualizations from REST data in Redash.
CData Connect Server provides a pure SQL Server interface for REST, allowing you to easily build reports from live REST data in Redash — without replicating the data to a natively supported database. As you build visualizations, Redash generates SQL queries to gather data. Using optimized data processing out of the box, CData Connect Server pushes all supported SQL operations (filters, JOINs, etc) directly to REST, leveraging server-side processing to quickly return the requested REST data.
Create a Virtual SQL Server Database for REST Data
CData Connect Server uses a straightforward, point-and-click interface to connect to data sources and generate APIs.
-
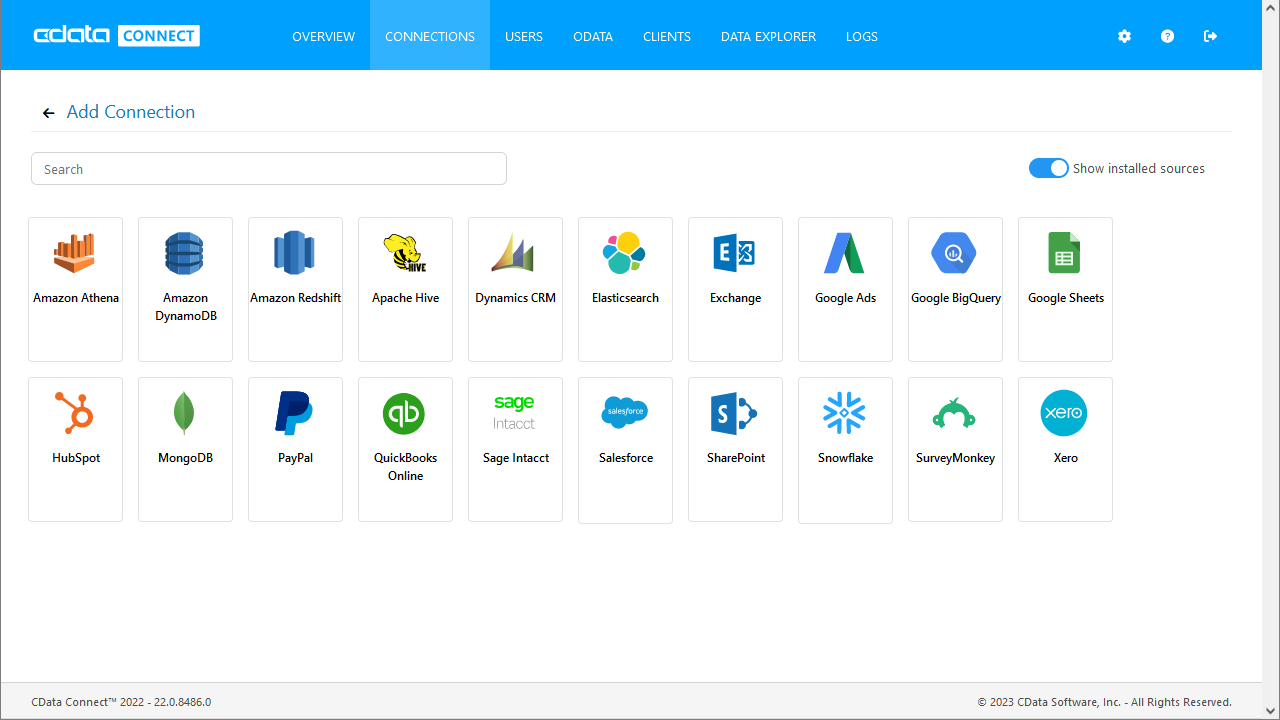
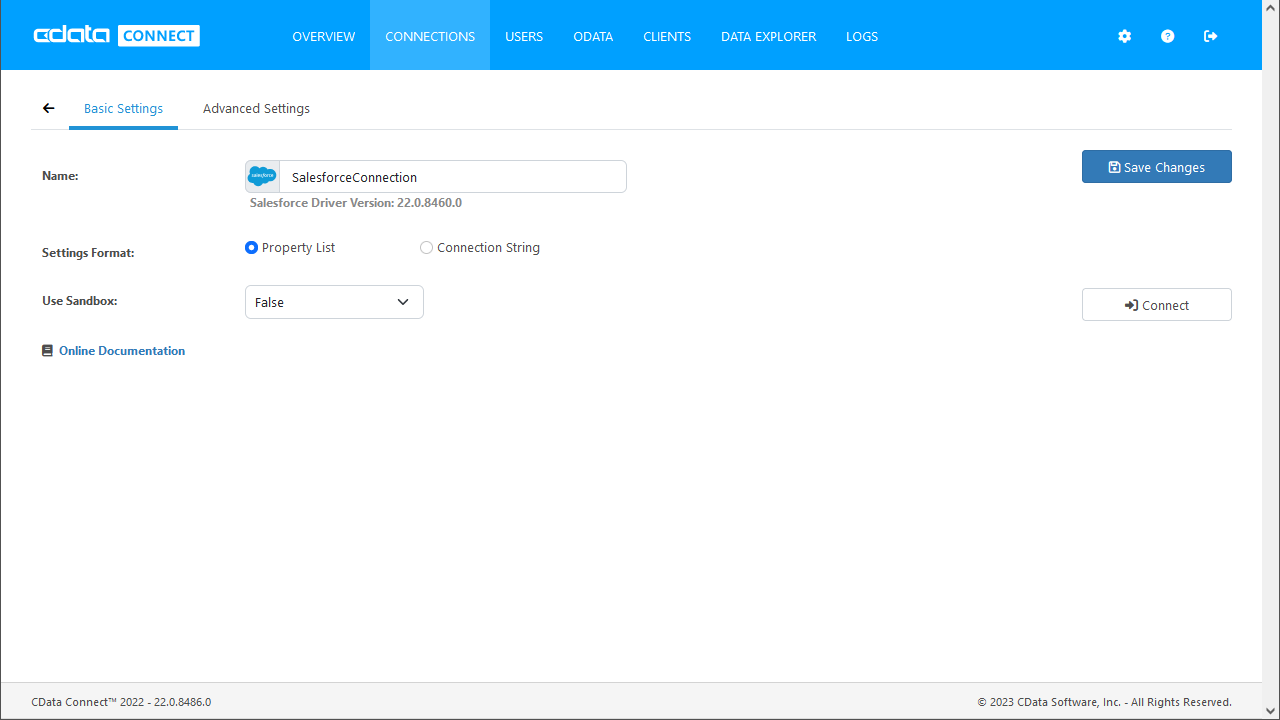
Login to Connect Server and click Connections.
![Adding a connection]()
- Select "REST" from Available Data Sources.
-
Enter the necessary authentication properties to connect to REST.
See the Getting Started chapter in the data provider documentation to authenticate to your data source: The data provider models REST APIs as bidirectional database tables and XML/JSON files as read-only views (local files, files stored on popular cloud services, and FTP servers). The major authentication schemes are supported, including HTTP Basic, Digest, NTLM, OAuth, and FTP. See the Getting Started chapter in the data provider documentation for authentication guides.
After setting the URI and providing any authentication values, set Format to "XML" or "JSON" and set DataModel to more closely match the data representation to the structure of your data.
The DataModel property is the controlling property over how your data is represented into tables and toggles the following basic configurations.
- Document (default): Model a top-level, document view of your REST data. The data provider returns nested elements as aggregates of data.
- FlattenedDocuments: Implicitly join nested documents and their parents into a single table.
- Relational: Return individual, related tables from hierarchical data. The tables contain a primary key and a foreign key that links to the parent document.
See the Modeling REST Data chapter for more information on configuring the relational representation. You will also find the sample data used in the following examples. The data includes entries for people, the cars they own, and various maintenance services performed on those cars.
![Configuring a connection (SQL Server is shown).]()
- Click Save Changes
- Click Privileges -> Add and add the new user (or an existing user) with the appropriate permissions.
With the virtual database created, you are ready to connect to REST data from Redash.
Visualize REST Data in Redash
The steps below outline creating a new data source in Redash based on the virtual REST database in Connect Server and building a simple visualization from the data.
Create a New Data Source
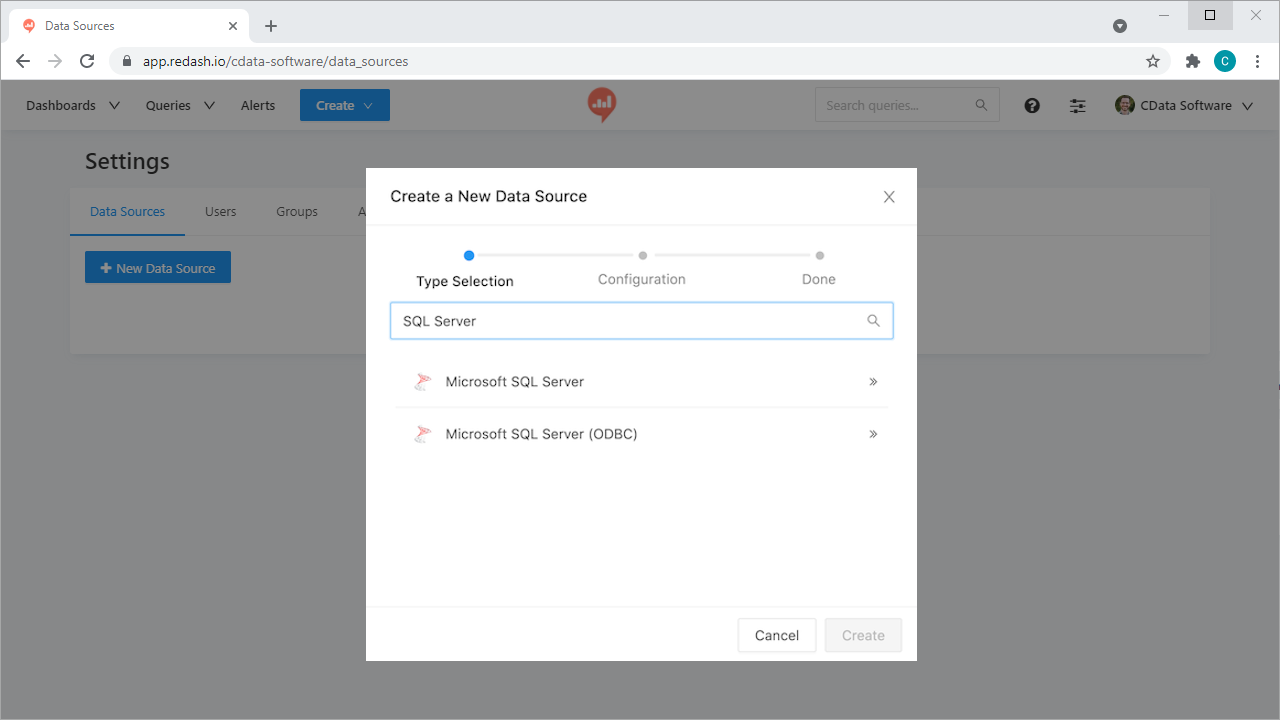
- Log into Redash, click on your profile and click "Data Sources"
- Click the " New Data Source" button
- Select "Microsoft SQL Server" as the Data Source Type
![Creating a new Data Source.]()
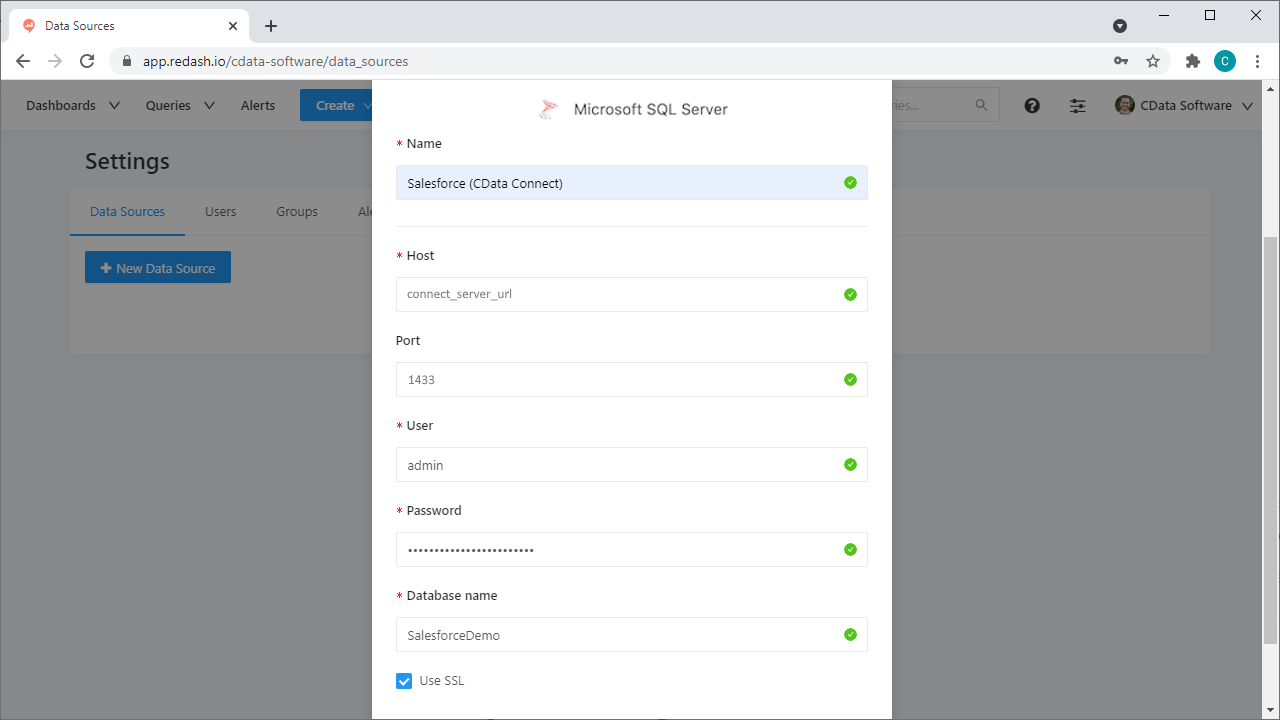
- On the configuration tab, set the following properties:
- Name: Name the data source (e.g. REST (CData Connect))
- Host: The full URL to your CData Connect instance (e.g. https://connect_server_url)
- Port: The port of the CData Connect SQL Server endpoint (e.g. 1433)
- User: A CData Connect user
- Password: The password for the above user
- Database name: The name of the virtual database for REST (e.g. REST1)
- Click the checkbox to Use SSQL
![Configuring the new Data Source.]()
- Click Create
- Click the "Test Connection" button to ensure you have configured the connection properly
With the new Data Source created, we are ready to visualize our REST data.
Create a REST Data Visualization
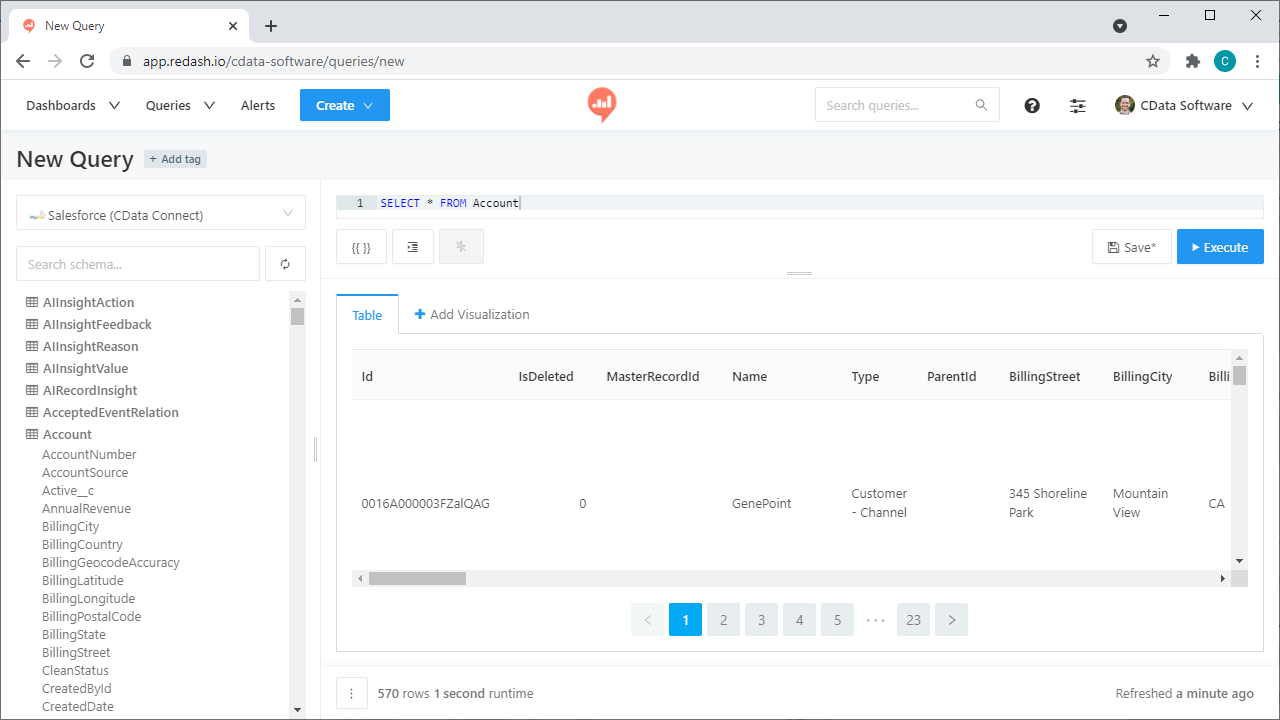
- Click Create -> New Query
- Select the newly created Data Source (you can explore the data structure in the New Query wizard)
- Write a SQL statement to retrieve the data, for example:
SELECT [people].[personal.age] AS age, [people].[personal.gender] AS gender, [people].[personal.name.first] AS first_name, [people].[personal.name.last] AS last_name, [vehicles].[model], FROM [people] JOIN [vehicles] ON [people].[_id] = [vehicles].[people_id] - Click the "Execute" button to load REST data into Redash via CData Connect
![Loading REST data into Redash]()
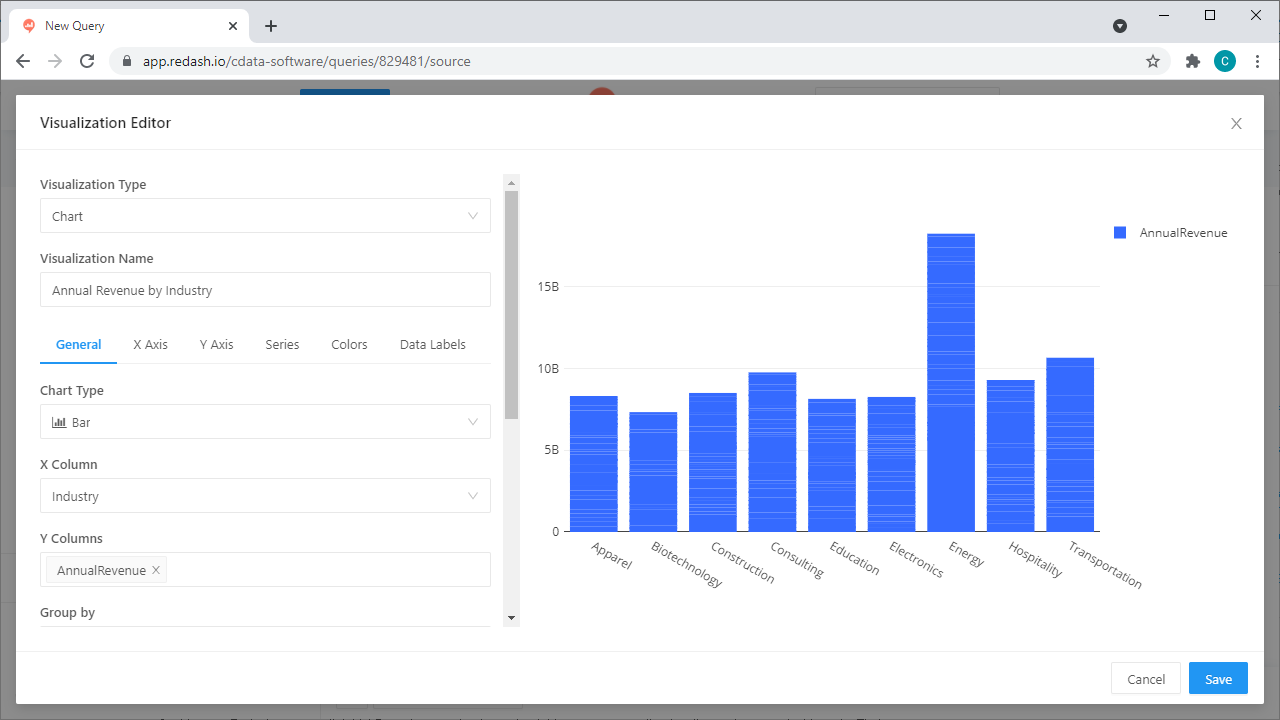
- Use the Visualization Editor to create and analyze graphs from REST data
![Choosing a Database and Tables]()
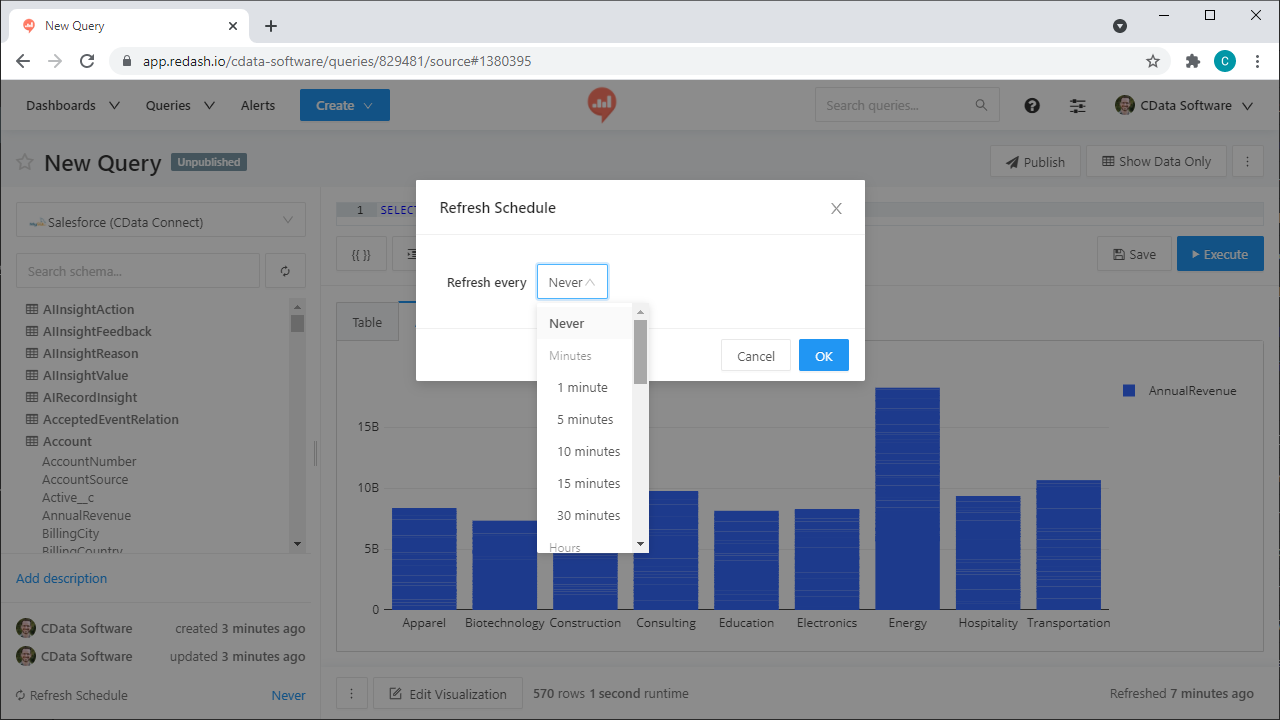
- You can schedule the query to refresh and update the visualization periodically
SQL Access to REST Data from Cloud Applications
At this point, you have a direct, cloud-to-cloud connection to REST data from Redash. You can create new visualizations, build dashboards, and more. For more information on gaining SQL access to data from more than 100 SaaS, Big Data, and NoSQL sources from cloud applications like Redash, refer to our Connect Server page.

