Discover how a bimodal integration strategy can address the major data management challenges facing your organization today.
Get the Report →Visualize Twitter Ads Data in Tableau Desktop (through CData Connect)
Create a virtual SQL Server database for Twitter Ads data in CData Connect (or Connect Server) and build visualizations from live Twitter Ads data in Tableau Desktop.
Tableau is a visual analytics platform transforming the way businesses use data to solve problems. When paired with CData Connect (or Connect Server), you can easily get access to live Twitter Ads data within Tableau.
CData Connect Server provides a pure SQL Server interface for Twitter Ads, allowing you to easily build reports from live Twitter Ads data in Tableau Desktop — without replicating the data to a natively supported database. As you build visualizations, Tableau Desktop generates SQL queries to gather data. Using optimized data processing out of the box, CData Connect Server pushes all supported SQL operations (filters, JOINs, etc) directly to Twitter Ads, leveraging server-side processing to quickly return the requested Twitter Ads data.
This article shows how to create a virtual SQL Server database for Twitter Ads, connect to the virtual database in Tableau, and build a simple chart.
Create a Virtual SQL Server Database for Twitter Ads Data
CData Connect Server uses a straightforward, point-and-click interface to connect to data sources and generate APIs.
-
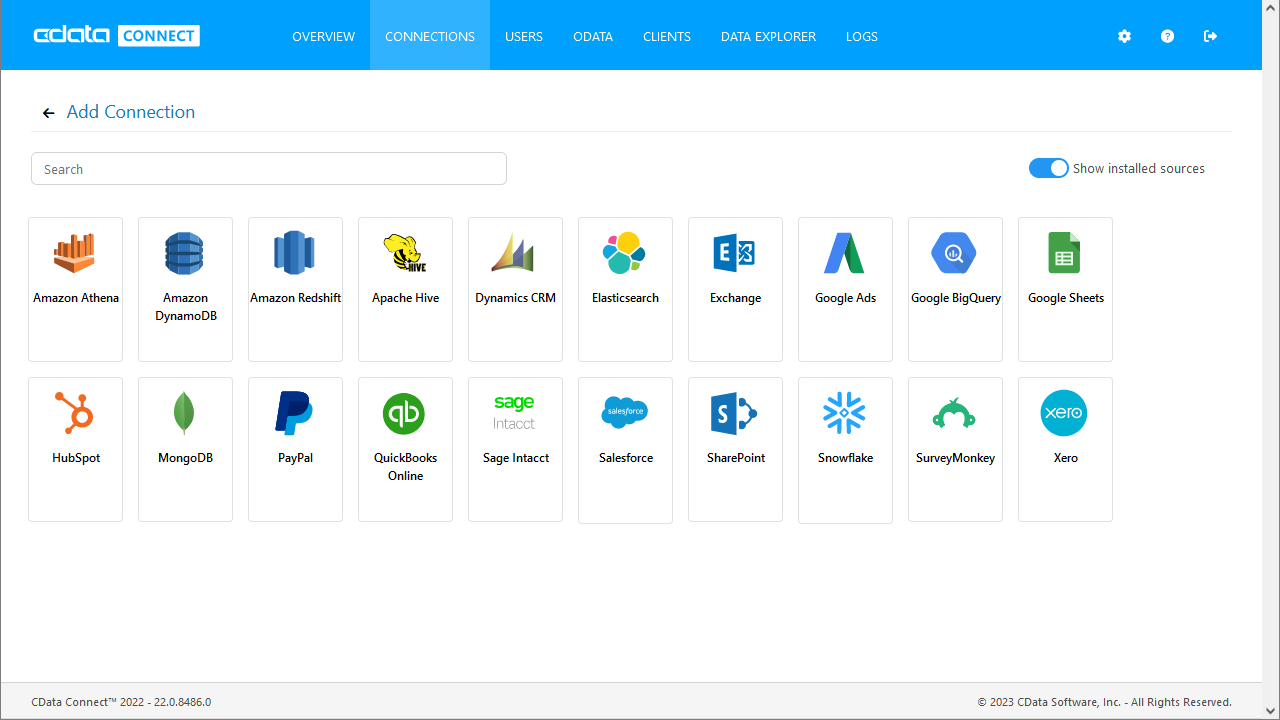
Login to Connect Server and click Connections.
![Adding a connection]()
- Select "Twitter Ads" from Available Data Sources.
-
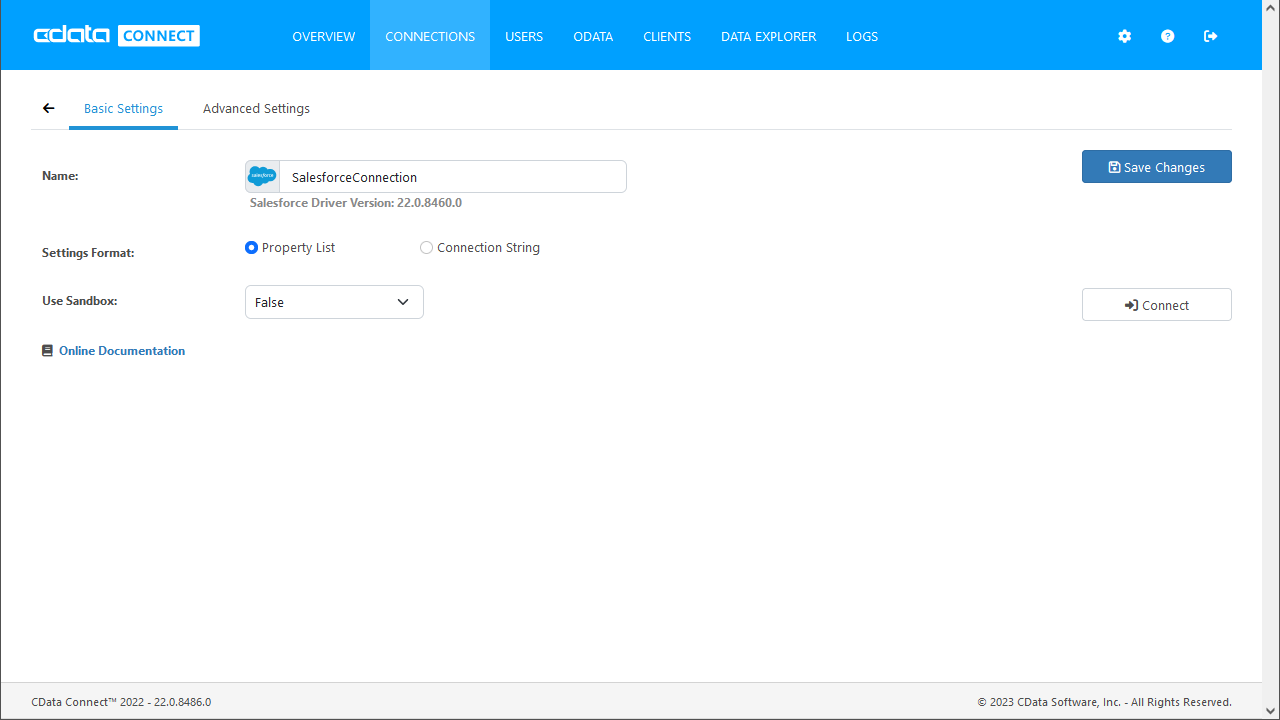
Enter the necessary authentication properties to connect to Twitter Ads.
All tables require authentication. You must use OAuth to authenticate with Twitter. OAuth requires the authenticating user to interact with Twitter using the browser. For more information, refer to the OAuth section in the Help documentation.
![Configuring a connection (SQL Server is shown).]()
- Click Save Changes
- Click Privileges -> Add and add the new user (or an existing user) with the appropriate permissions.
With the virtual database created, you are ready to connect to Twitter Ads data from Tableau Desktop.
Visualize Live Twitter Ads Data in Tableau Desktop
The steps below outline connecting to the virtual Twitter Ads database in CData Connect and building a simple visualization from the data.
- Open Tableau and click "Microsoft SQL Server" under Connect -> To a Server.
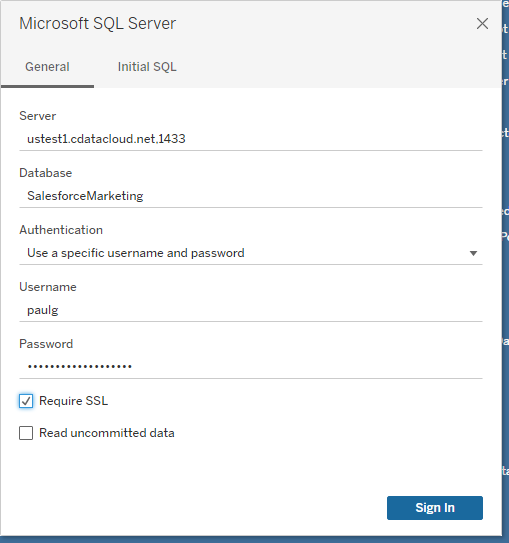
- In the connection wizard, enter the values for your CData Connect instance and click "Sign In"
- Server: the address of your Connect instance and port of the TDS endpoint, separated by a comma (default port is: 1433)
- Database: the virtual database you configured for the Twitter Ads data
- Username & Password: the credentials for a CData Connect user
![Connect to CData Connect from Tableau Desktop]()
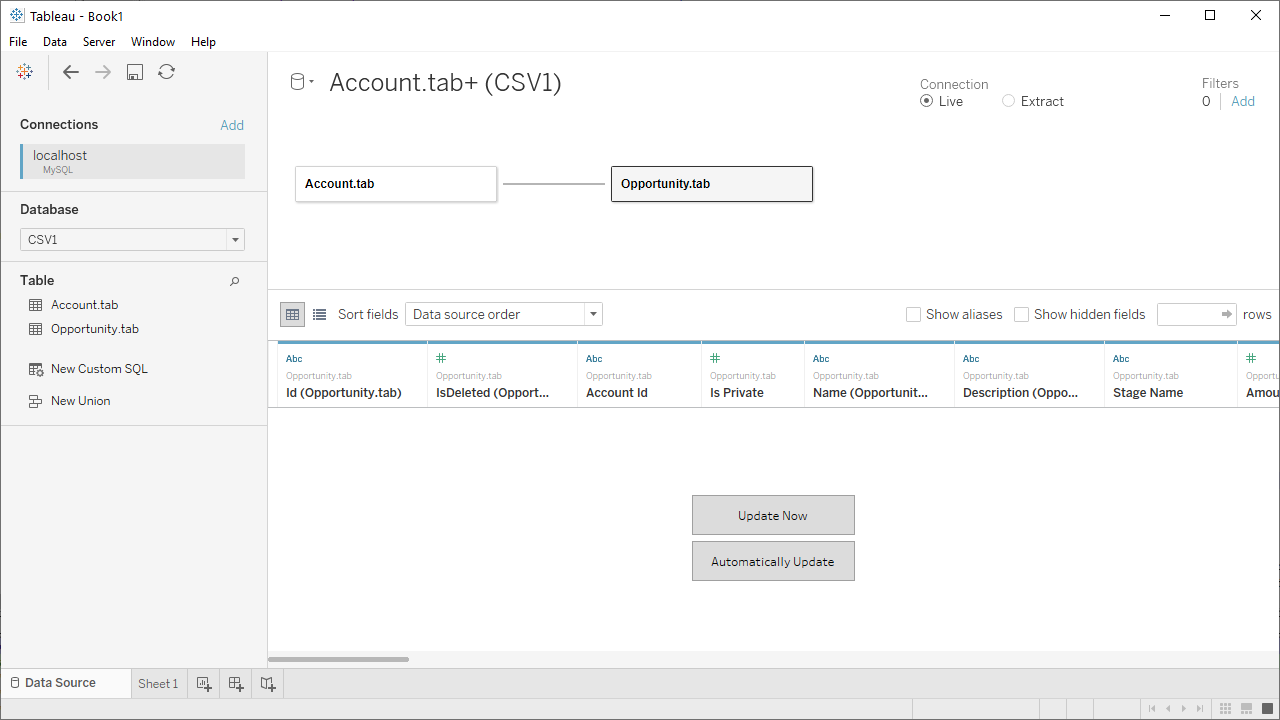
- Select your newly created database and the table(s) you wish to visualize (defining relationships for JOINed tables as needed).
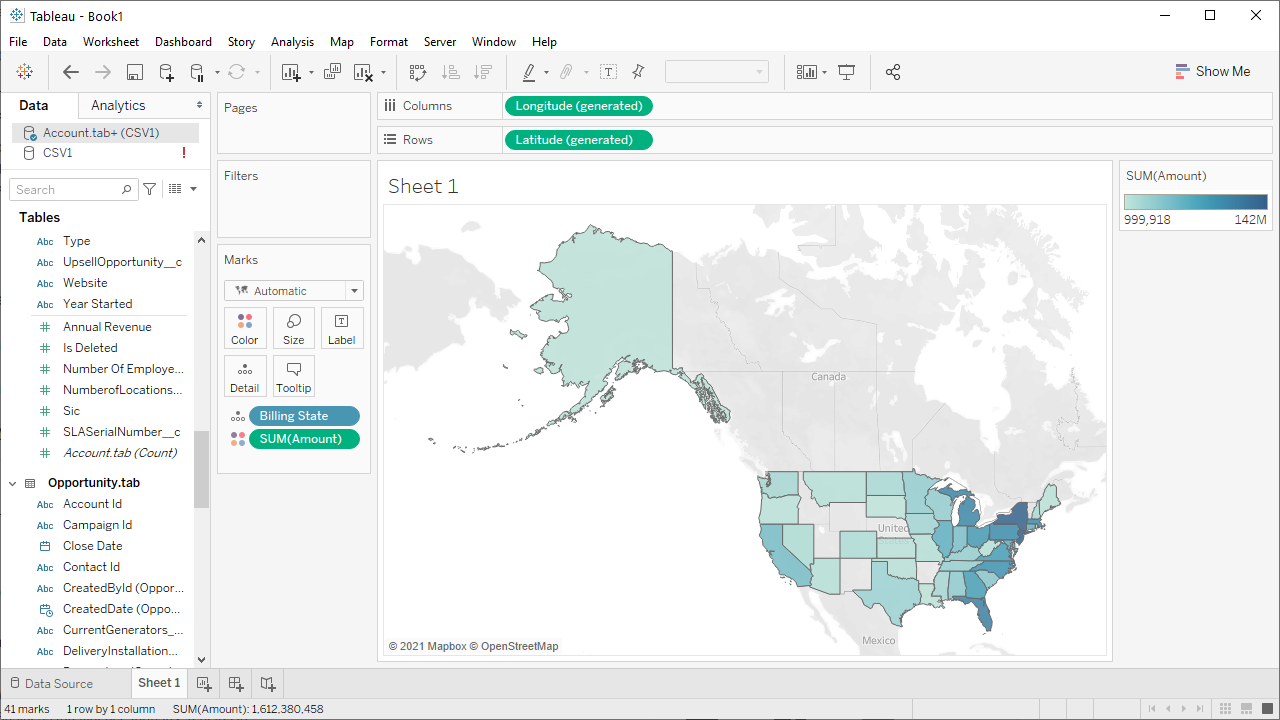
- Select Dimensions and Measures and configure your visualization.
SQL Access to Twitter Ads Data from On-Premise Applications
At this point, you have a direct connection to live Twitter Ads data from your Tableau Desktop workbook. You can create new visualizations, build dashboards, and more. For more information on gaining SQL access to data from more than 200 SaaS, Big Data, and NoSQL sources (including Twitter Ads) from desktop applications like Tableau refer to our CData Connect page or download a free trial.


