Discover how a bimodal integration strategy can address the major data management challenges facing your organization today.
Get the Report →Analyze Printify Data in SAP Analytics Cloud
Use the CData Connect Server to create an OData API on top of Printify data and visualize Printify data in SAP Analytics Cloud.
SAP Analytics Cloud is a cloud-based business intelligence platform. The CData Connect Server creates a virtual database for Printify and can be used to generate an OData API (natively consumable in Analytics Cloud) for Printify. By pairing SAP Analytics Cloud with the CData Connect Server, you get direct connectivity to all of your SaaS and cloud-based Big Data and NoSQL sources — no need to migrate your data or write your integrations. Simply connect to Connect Server as you would any other OData service and get instant, consolidated access to all of your data.
In this article, we walk through connecting to Printify in Connect Server and connecting to Connect Server from Analytics Cloud to create a model and build a simple dashboard.
Configure Connect Server to Connect to Printify
To connect to Printify data from SAP Analytics Cloud, you need to configure Printify access from your Connect Server instance. This means creating a user, connecting to Printify, adding OData endpoints, and (optionally) configuring CORS.
Add a Connect Server User
Create a User to connect to Printify from Analytics Cloud through Connect Server.
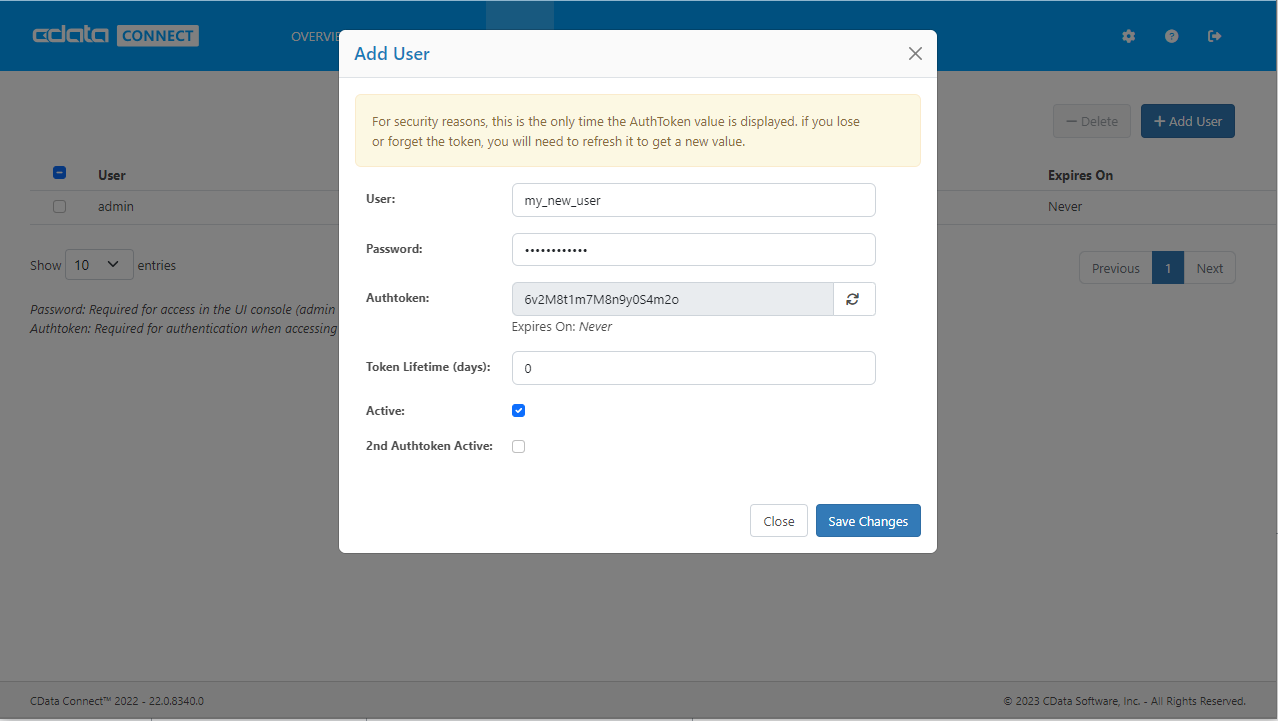
- Click Users -> Add
- Configure a User
![Creating a new user]()
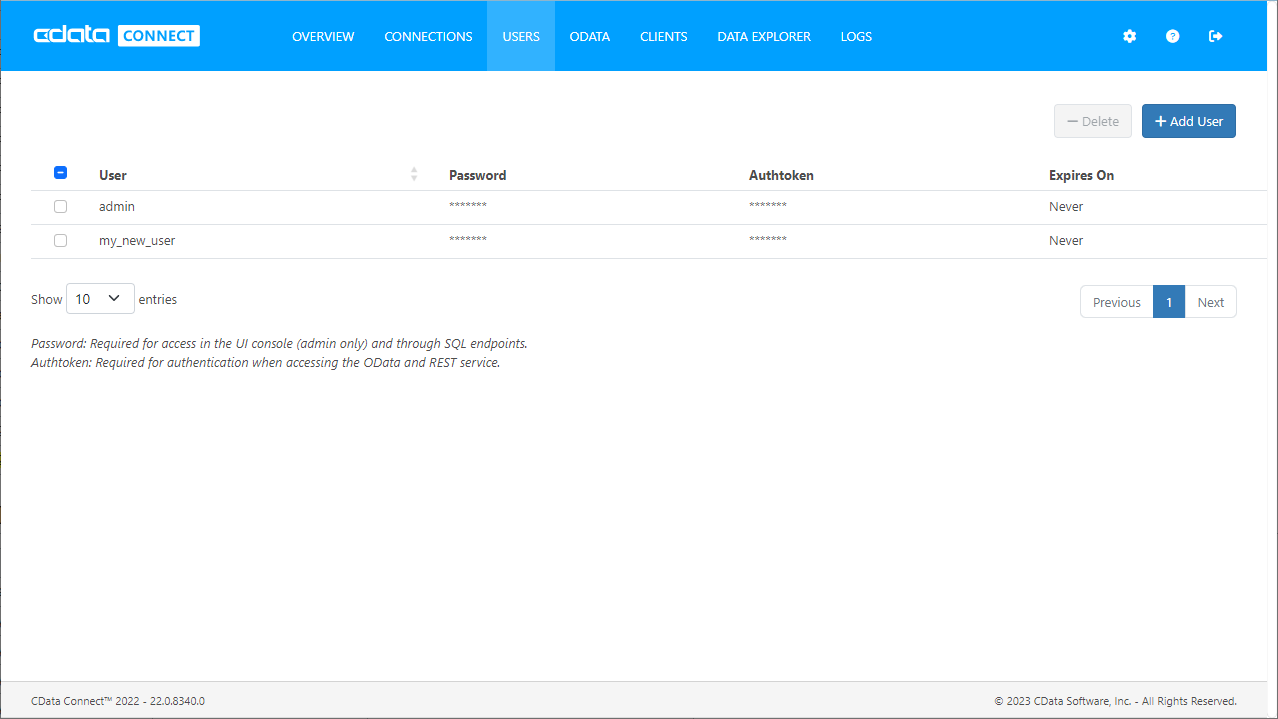
- Click Save Changes and make note of the Authtoken for the new user
![Connect Server users]()
Connect to Printify from Connect Server
CData Connect Server uses a straightforward, point-and-click interface to connect to data sources and generate APIs.
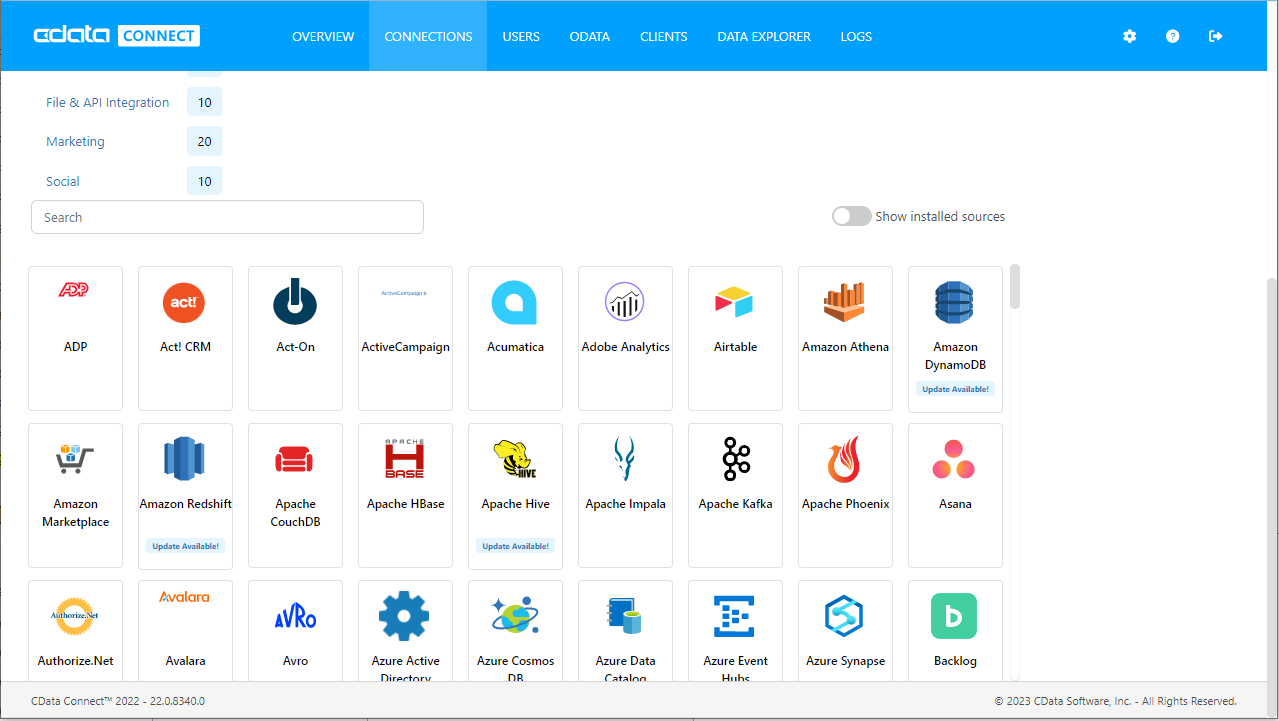
- Open Connect Server and click Connections
![Adding a connection]()
- Select "Printify" from Available Data Sources
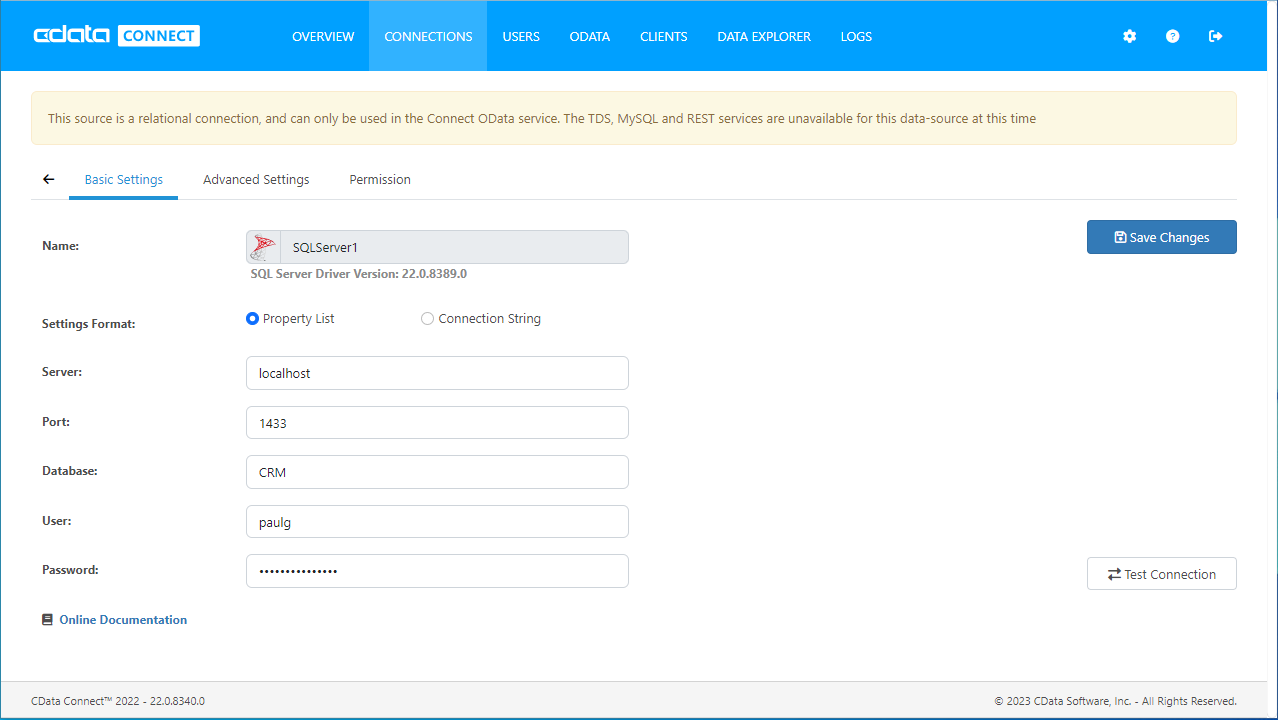
- Enter the necessary authentication properties to connect to Printify.
Start by setting the Profile connection property to the location of the Printify Profile on disk (e.g. C:\profiles\Profile.apip). Next, set the ProfileSettings connection property to the connection string for Printify (see below).
Printify API Profile Settings
In order to authenticate to Printify, you'll need to provide your API Key. To get your API Key navigate to My Profile, then Connections. In the Connections section you will be able to generate your Personal Access Token (API Key) and set your Token Access Scopes. Personal Access Tokens are valid for one year. An expired Personal Access Token can be re-generated using the same steps after it expires. Set the API Key to your Personal Access Token in the ProfileSettings property to connect.
![Configuring a connection (SQL Server is shown).]()
- Click Save Changes
- Click Privileges -> Add, and add the new user (or an existing user) with the appropriate permissions (SELECT is all that is required for Reveal)
Add Printify OData Endpoints in Connect Server
After connecting to Printify, create OData Endpoint for the desired table(s).
- Click OData -> Tables -> Add Tables
- Select the Printify database
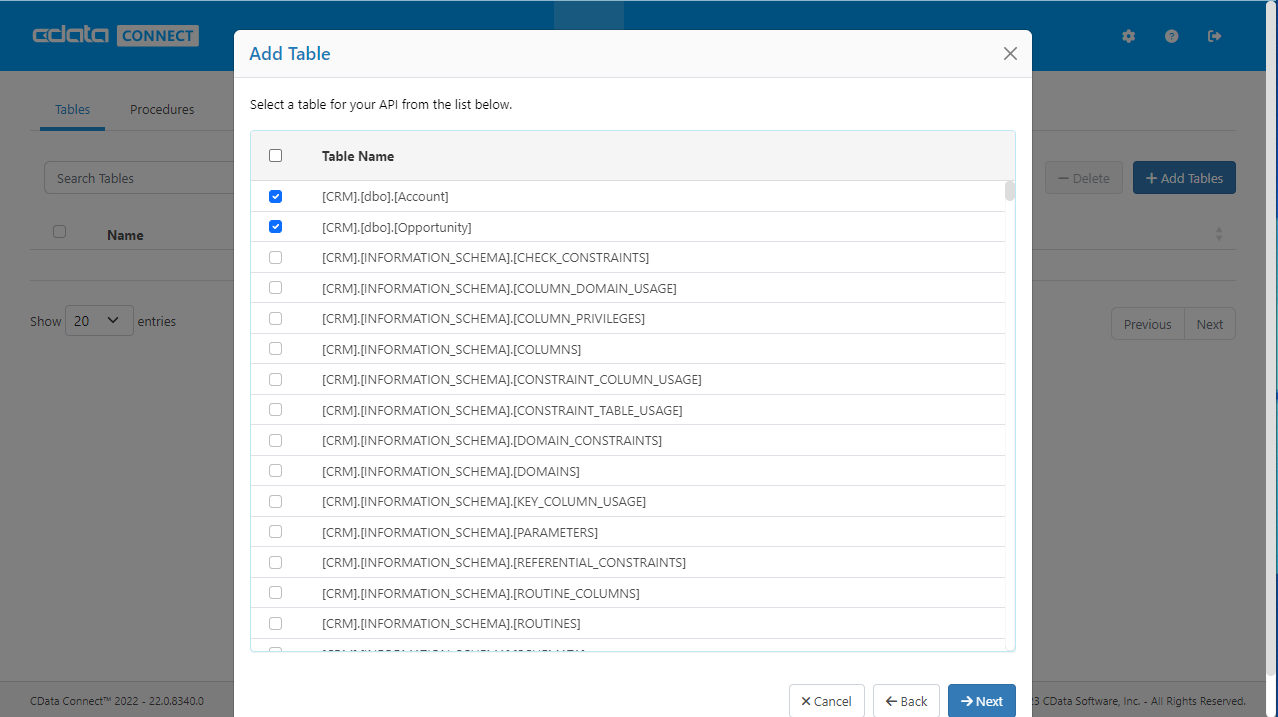
- Select the table(s) you wish to work with and click Next
![Selecting a Table (SQL Server is shown)]()
- (Optional) Edit the resource to select specific fields and more
- Save the settings
(Optional) Configure Cross-Origin Resource Sharing (CORS)
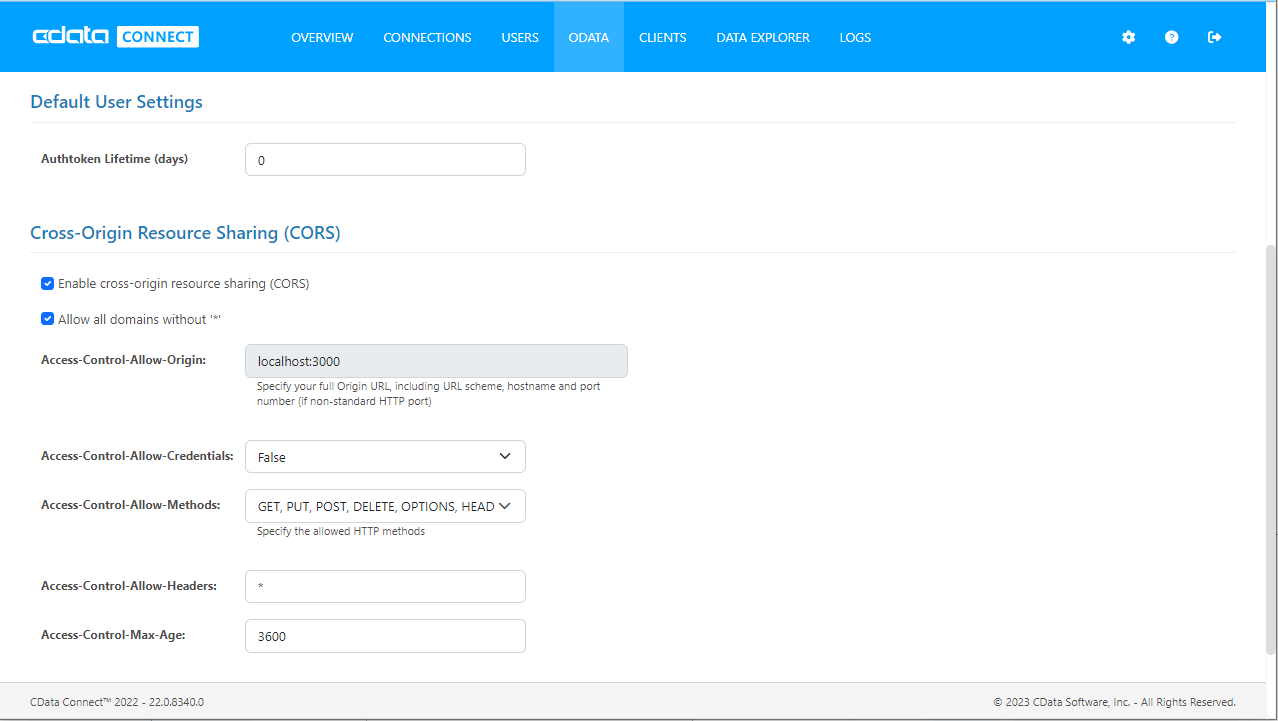
When accessing and connecting to multiple different domains from an application such as Ajax, there is a possibility of violating the limitations of cross-site scripting. In that case, configure the CORS settings in OData -> Settings.
- Enable cross-origin resource sharing (CORS): ON
- Allow all domains without '*': ON
- Access-Control-Allow-Methods: GET, PUT, POST, OPTIONS
- Access-Control-Allow-Headers: Authorization
Save the changes to the settings.
Create a Model of Printify Data in SAP Analytics Cloud
With the connection to Printify configured and the OData endpoint(s) created, we can create a Model for Printify data in SAP Analytics Cloud.
- Log into your Analytics Cloud instance and click Create -> Model from the menu.
- Choose "Get data from a datasource" and select "OData Services"
- Choose an existing connection to your Connect Server OData or Create a new one:
- Set "Connection Name"
- Set "Data Service URL" to the Base URL for your OData API (typically: CONNECT_SERVER_URL/api.rsc)
- Set "Authentication Type" to Basic Authentication
- Set "User Name" to the Connect Server user you configured earlier
- Set "Password" to the Authtoken for the above user
![Creating a new OData Services Connection]()
- Choose "Create a new query" and click Next
- Name the Query, select an OData endpoint (like apidb_Tags) and click Next
![Choosing a Connect Server OData endpoint to query]()
- Drag the columns you wish to work with into the Selected Data workspace and click Create
![Selecting fields (columns) from the OData endpoint]()
- At this point, a Draft Data source is created; click the draft to finalize the model
- Perform any transformations, including creating calculated dimensions, location dimensions, and combining data sources, then click Create Model
![Finalizing the model]()
- Name your model and click OK
Build a Dashboard in SAP Analytics Cloud
With the model created, you are ready to create a dashboard in SAP Analytics Cloud based on Printify data.
- From the menu, click Create -> Story
- Click an SAP Analytics Template (this article uses the "Dashboard" template)
- Choose a layout and click Apply
- From the More menu, select a visualization to insert (Chart)
![Inserting a visualization]()
- Select a model to visualize
- Select a structure and the required Measures and Dimensions
- Save the story
![Saving the Story]()
More Information & Free Trial
Now, you have created a simple but powerful dashboard from live Printify data. For more information on creating OData feeds from Printify (and more than 200 other data sources), visit the Connect Server page. Sign up for a free trial and start working with live Printify data in SAP Analytics Cloud.

