Publish Crystal Reports on Alchemy Data

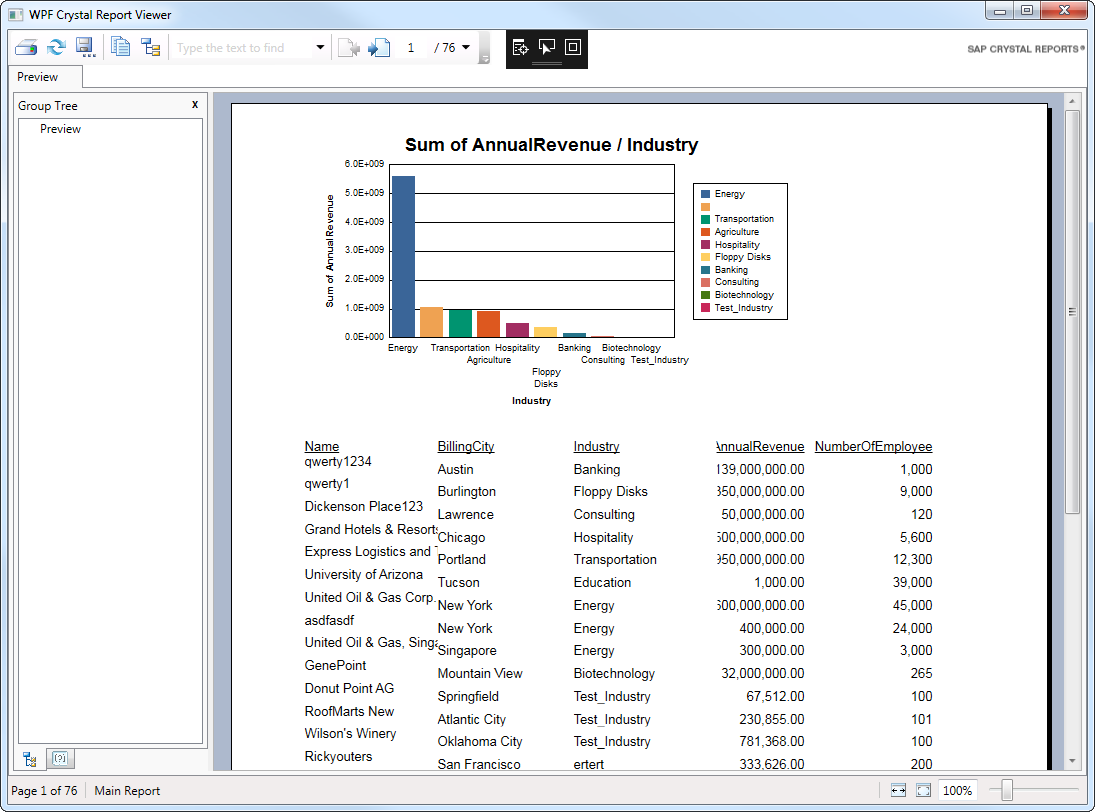
The CData ADO.NET Provider for Alchemy is fully integrated into the SAP Crystal Reports for Visual Studio development environment. You can employ standard ADO.NET components to construct reports, much like you would with SQL Server, but with the added advantage of real-time connectivity to Alchemy. This article will guide you through the essential three steps to incorporate Alchemy data into a report that refreshes upon opening.
Note: You will need to install SAP Crystal Reports, developer version for Visual Studio to follow this tutorial.
Create a Crystal Reports Application
To follow this article, you will also need a Visual Studio Crystal Reports project. This article will add a report to a WPF application. You can create one by clicking File -> New Project and then selecting the Crystal Reports WPF Application template. In the resulting wizard, select the option to create a blank report.
Connect to Alchemy
Creating an ADO.NET data source for Alchemy from Server Explorer makes it easy to create a DataSet that can be used in Crystal Reports wizards and the Crystal Reports Designer. You can find a guide to working with Alchemy data in Server Explorer in the "Getting Started" chapter of the help documentation.
Start by setting the Profile connection property to the location of the Alchemy Profile on disk (e.g. C:\profiles\Alchemy.apip). Next, set the ProfileSettings connection property to the connection string for Alchemy (see below).
Alchemy API Profile Settings
Alchemy uses API key authentication. The API key is supplied in the request URL path. To obtain an API key:
- Sign in to your Alchemy account at https://dashboard.alchemy.com.
- Open an existing app or create a new one.
- Copy the app's API key from the API Key dialog.
After obtaining your API key, set the following connection properties:
- AuthScheme: Set this to APIKey.
- Network: Optional. The blockchain network slug for NFT API requests (for example, eth-mainnet, base-mainnet, polygon-mainnet). Defaults to eth-mainnet.
Set the following in the ProfileSettings connection property:
- APIKey: Set this to your Alchemy app API key.
When you configure the connection, you may also want to set the Max Rows connection property. This will limit the number of rows returned, which is especially helpful for improving performance when designing reports and visualizations.
Create a DataSet
Follow the steps below to use the Visual Studio ADO.NET DataSet Designer to create an ADO.NET DataSet object. Crystal Reports will bind to the DataSet object, which contains Alchemy table metadata. Note that this approach also adds a connection string to App.config; you will use this connection string later to load data into the report.
- In the Solution Explorer, right-click your project and then click Add -> New Item.
- Select DataSet. The DataSet Designer is then displayed.
- Drag and drop tables from Server Explorer onto the DataSet Designer. This article uses the ContractsForOwner table.
Add Alchemy Fields to the Report
Follow the steps below to add columns from the DataSet to the report:
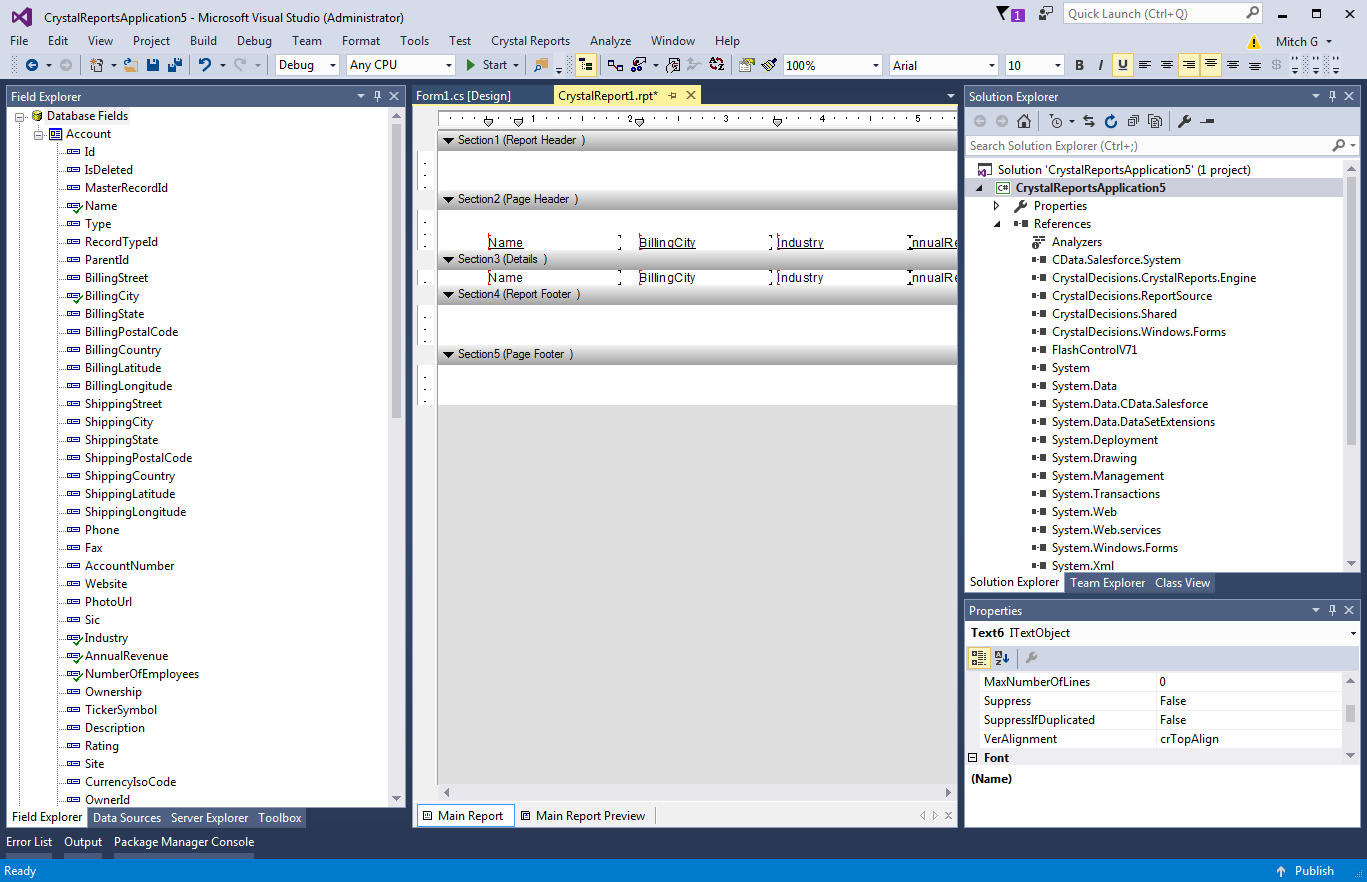
- Double-click the .rpt file in the Solution Explorer to open the Crystal Reports Designer.
- Right-click the designer and click Database -> Database Expert.
- Expand the Project Folder and ADO.NET DataSets nodes and drag the DataSet you created into the Selected Tables box. The fields are now accessible from the Field Explorer.
- Drag and drop fields from the Field Explorer to the Details section or another section of your report.
Load Data into the Report
Having created the DataSet, which will only contain the metadata, you will now need to create the DataTable containing the actual data. You can use the APIDataAdapter to fill a DataTable with the results of an SQL query.
- Add a reference to System.Configuration.dll to your project to be able to use the connection string from App.config.
- In App.config, add the following code to the configuration node for compatibility with Crystal Reports when working with .NET 4.0:
  <startup useLegacyV2RuntimeActivationPolicy="true">
    <supportedRuntime version="v4.0" sku=".NETFramework,Version=v4.0"/>
  </startup>
Add the following references in your Window.xaml.cs file:
using System.Configuration;
using CrystalDecisions.CrystalReports.Engine;
using CrystalDecisions.Shared;
using System.Data.CData.API;
using System.Data;
-
Add the following Window_Loaded method in your Window.xaml.cs to execute the SQL query that will return the DataTable. Note that your query needs to select at least the same columns used in your report.
private void Window_Loaded(object sender, RoutedEventArgs e) {
  ReportDocument report = new ReportDocument();
  report.Load("../../CrystalReport1.rpt");
 var connectionString = ConfigurationManager.ConnectionStrings["MyAppConfigConnectionStringName"].ConnectionString;
  using (APIConnection connection = new APIConnection(connectionString)) {
    APIDataAdapter dataAdapter = new APIDataAdapter(
    "SELECT Address, Name FROM ContractsForOwner WHERE Owner = '0xd8dA6BF26964aF9D7eEd9e03E53415D37aA96045'", connection);
     DataSet set = new DataSet("_set");
     DataTable table = set.Tables.Add("_table");
     dataAdapter.Fill(table);
     report.SetDataSource(table);
  }
  reportViewer.ViewerCore.ReportSource = report;
}
In the Window.xaml file, add the Loaded event so that your Window tag resembles the following:
<Window x:Class="CrystalReportWpfApplication4.Window1" xmlns="http://schemas.microsoft.com/winfx/2006/xaml/presentation" xmlns:x="http://schemas.microsoft.com/winfx/2006/xaml" xmlns:cr="clr-namespace:SAPBusinessObjects.WPF.Viewer;assembly=SAPBusinessObjects.WPF.Viewer" Title="WPF Crystal Report Viewer" Height="600" Width="800" Loaded="Window_Loaded"> ... </Window>- Run the report. When the report is loaded, the provider executes the query to retrieve the current data.
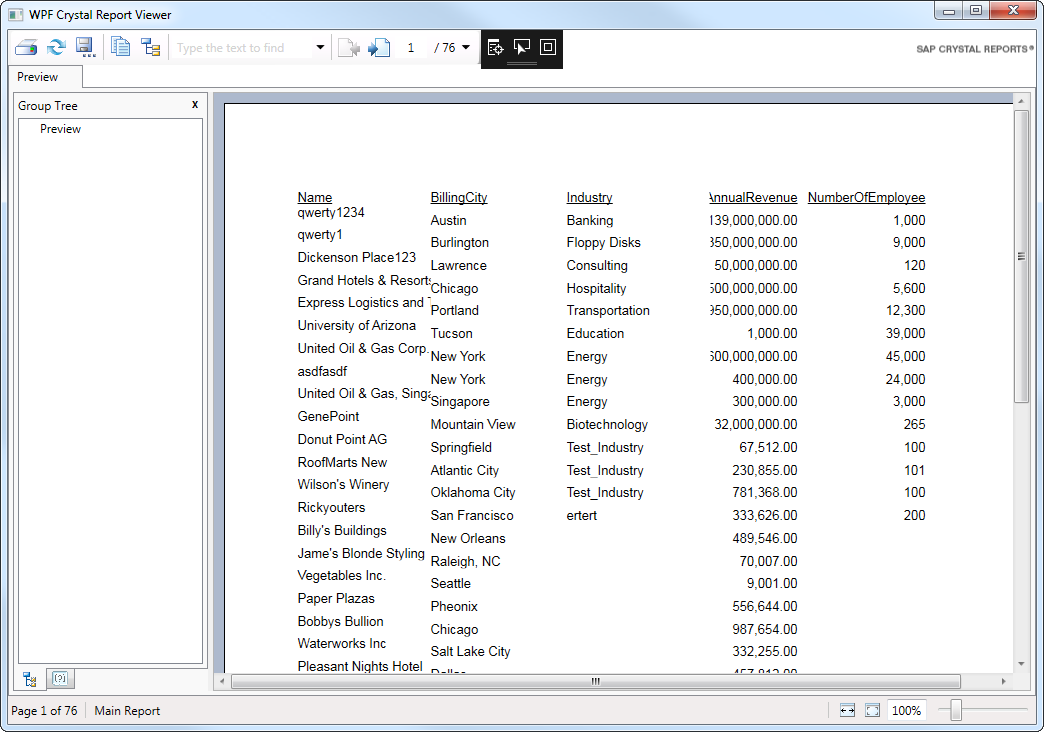
Chart Alchemy Data
You can also use the DataSet with experts like the Chart Expert:
- Right-click in the Crystal Reports Designer and click Insert -> Chart.
- Select the Report Header or Report Footer section. The Chart Expert is then displayed.
- On the Type tab, select the chart type. This article uses a side-by-side bar chart.
- On the Data tab, select the column and conditions for the x-axis. For example, drag the Address column in the DataSet node onto the box under the On Change Of menu.
- Select the x-axis column and click the TopN and Order buttons to configure sorting and limiting.
- Select the columns and summary operations for the y-axis. For example, drag the Name column in the DataSet node into the Show Values box.
- Run the report.
Note that Crystal Reports performs the aggregation on the data already loaded into DataTable, instead of, for example, executing a GROUP BY to the Alchemy API. This will also be true for the report creation wizards.
You could gain more control over the queries executed to Alchemy by creating another DataSet and populating it with a different query. See the help documentation for more information on the driver's SQL engine.