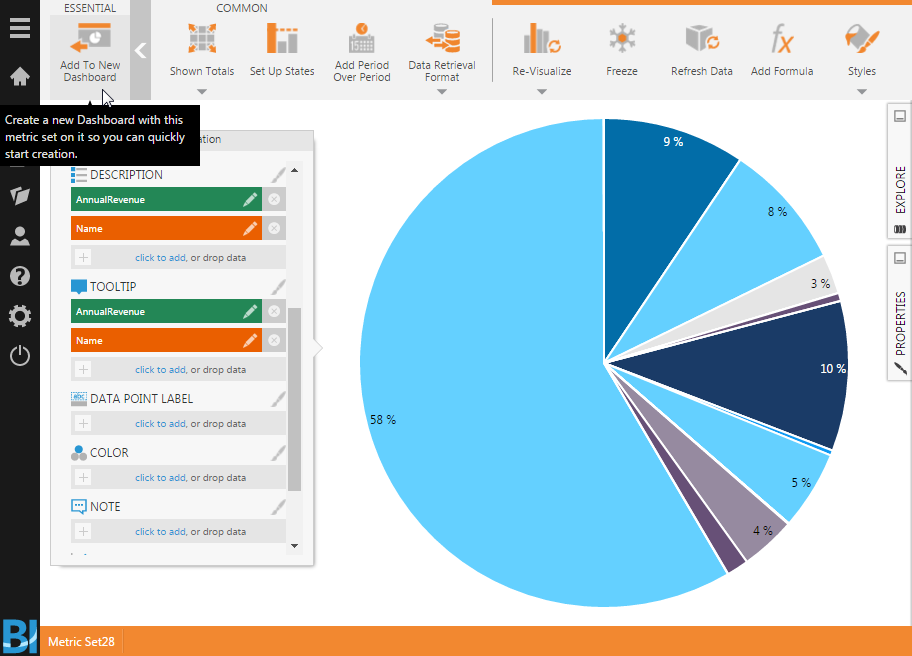
Build Dashboards with Alchemy Data in Dundas BI

The CData ODBC Driver for Alchemy enables access to live data from Alchemy under the ODBC standard, allowing you work with Alchemy data in a wide variety of BI, reporting, and ETL tools and directly, using familiar SQL queries. This article shows how to connect to Alchemy data as a generic ODBC Data Provider and create charts, reports, and dashboards based on Alchemy data in Dundas BI.
Connect to Alchemy Data
- If you have not already done so, provide values for the required connection properties in the data source name (DSN). You can configure the DSN using the built-in Microsoft ODBC Data Source Administrator. This is also the last step of the driver installation. See the "Getting Started" chapter in the Help documentation for a guide to using the Microsoft ODBC Data Source Administrator to create and configure a DSN.
Start by setting the Profile connection property to the location of the Alchemy Profile on disk (e.g. C:\profiles\Alchemy.apip). Next, set the ProfileSettings connection property to the connection string for Alchemy (see below).
Alchemy API Profile Settings
Alchemy uses API key authentication. The API key is supplied in the request URL path. To obtain an API key:
- Sign in to your Alchemy account at https://dashboard.alchemy.com.
- Open an existing app or create a new one.
- Copy the app's API key from the API Key dialog.
After obtaining your API key, set the following connection properties:
- AuthScheme: Set this to APIKey.
- Network: Optional. The blockchain network slug for NFT API requests (for example, eth-mainnet, base-mainnet, polygon-mainnet). Defaults to eth-mainnet.
Set the following in the ProfileSettings connection property:
- APIKey: Set this to your Alchemy app API key.
When you configure the DSN, you may also want to set the Max Rows connection property. This will limit the number of rows returned, which is especially helpful for improving performance when designing reports and visualizations.
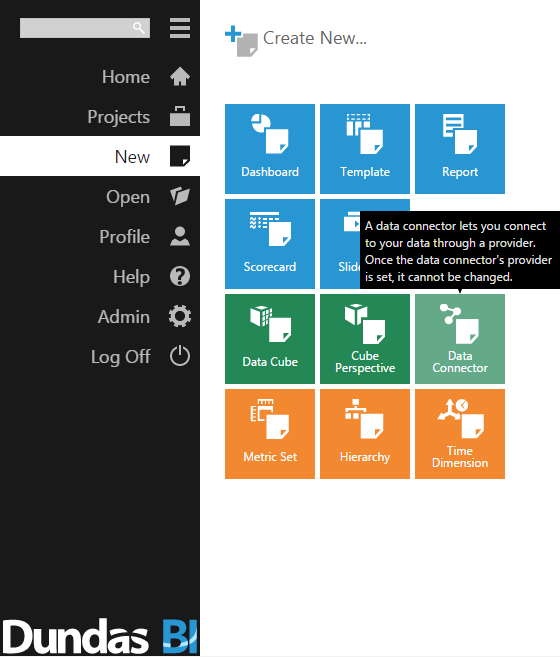
- Open the Dundas BI interface, open the menu, and click New Data Connector.
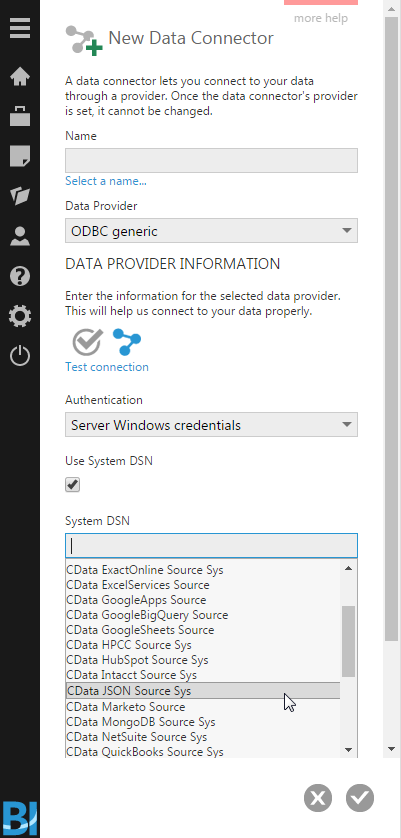
- Configure the Dundas BI Data Connector:
- Name the Data Connector.
- Select "ODBC generic" as the Data Provider.
- Check the "Use System DSN" checkbox.
- Select the appropriate System DSN.
Add Alchemy Data to a Dashboard
You are now ready to create a dashboard with Alchemy data.
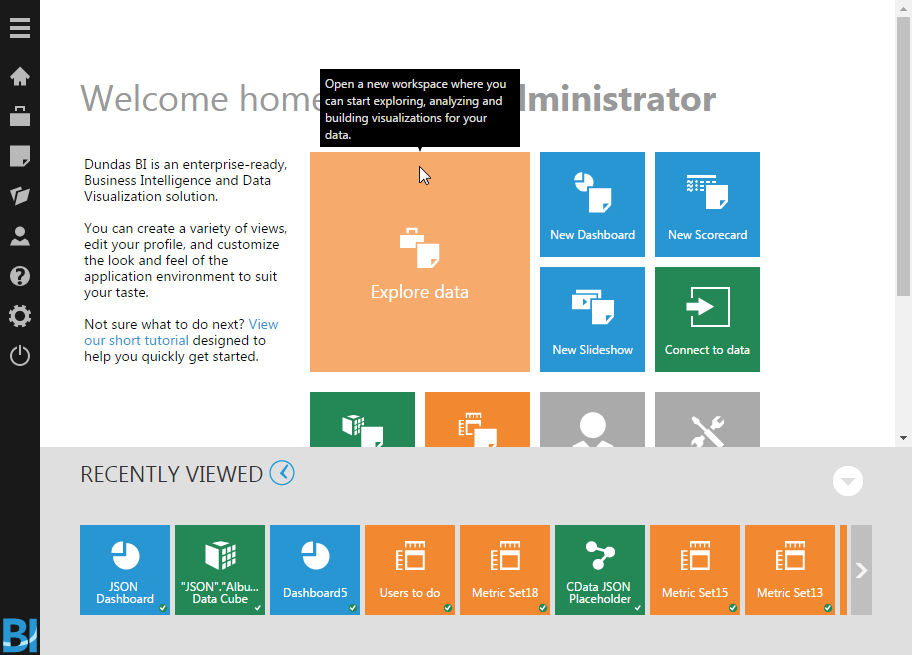
- Navigate to the Home page.
- Click Explore Data.
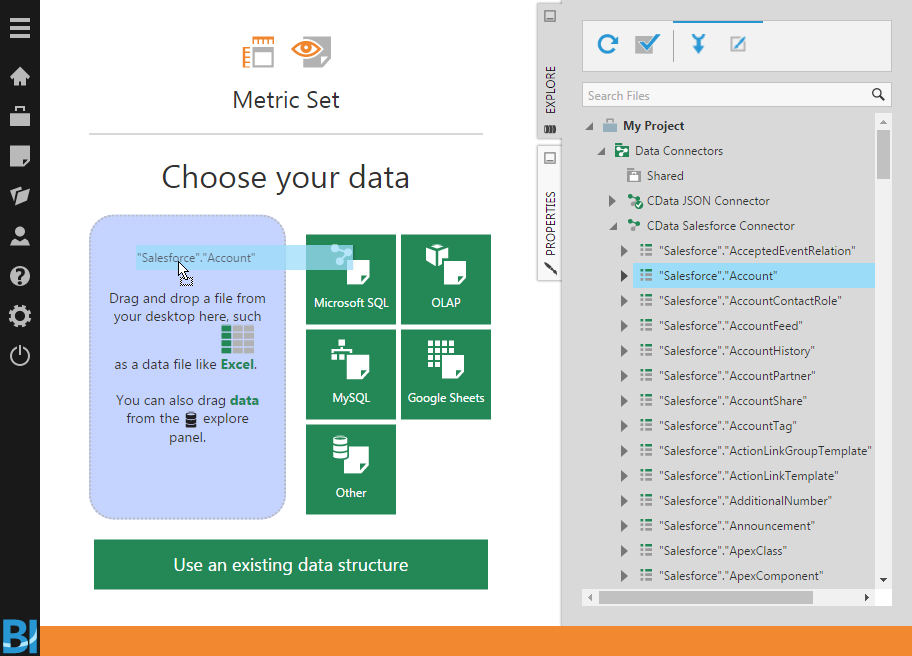
- Expand the appropriate Data Connector.
- Drag the relevant data from the Connector to the panel.
- You can select an entire "table" to add, but you may need to remove Measures/Rows from the Metric Set to build an appropriate visualization. Alternatively, you can select only the fields you wish to include in the visualization.
- With the fields selected, you can add any filters or conditions on the Measures and Rows, further customizing the visualization.
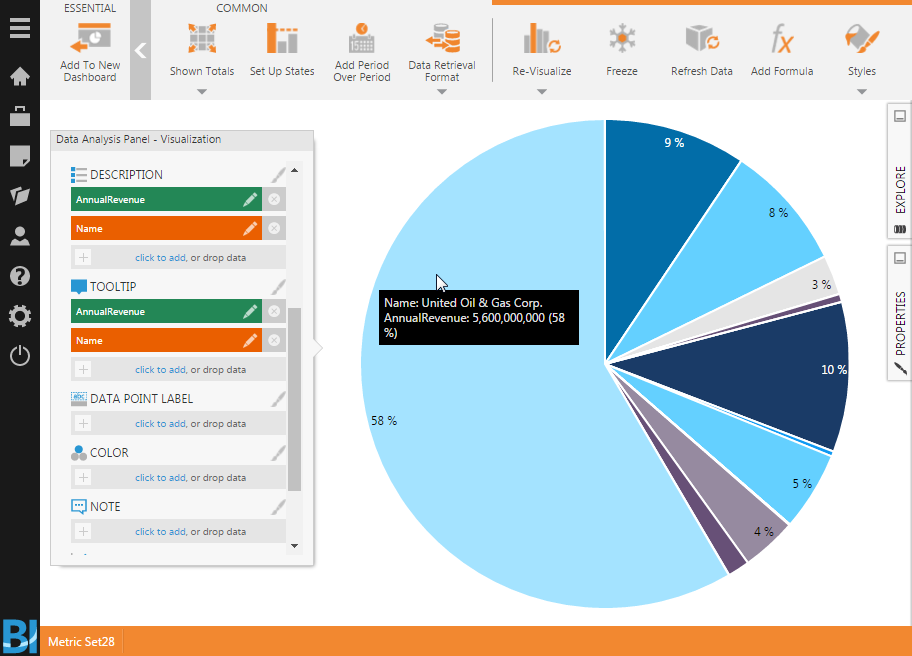
- Click Re-visualize from the menu bar and select the appropriate visualization for the data.
- Click Add To New Dashboard to add the visualization to a new dashboard.
- Configure the dashboard, creating dynamic visualizations of Alchemy data.