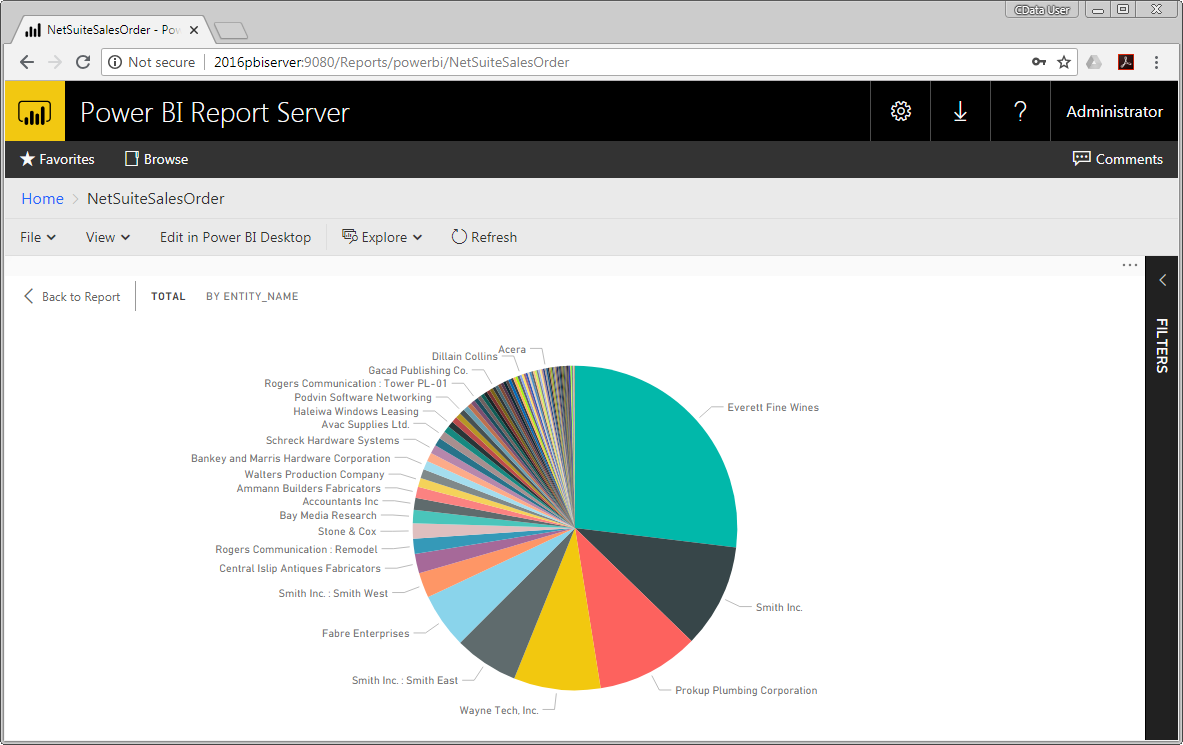
View Reports on Real-Time Alchemy Data in Power BI Report Server

With built-in support for ODBC on Microsoft Windows, CData ODBC Drivers provide self-service integration with self-service analytics tools, such as Microsoft Power BI. The CData ODBC Driver for Alchemy links your Power BI reports to operational Alchemy data. You can monitor Alchemy data through dashboards and ensure that your analysis reflects Alchemy data in real time by scheduling refreshes or refreshing on demand. This article details how to use the ODBC driver to create real-time visualizations of Alchemy data in Microsoft Power BI Desktop and then publish the visualizations to Power BI Report Server.
The CData ODBC Drivers offer unmatched performance for interacting with live Alchemy data in Power BI due to optimized data processing built into the driver. When you issue complex SQL queries from Power BI to Alchemy, the driver pushes supported SQL operations, such as filters and aggregations, directly to Alchemy and uses the embedded SQL Engine to process unsupported operations (often SQL functions and JOIN operations) client-side. With built-in dynamic metadata querying, you can visualize and analyze Alchemy data using native Power BI data types.
Connect to Alchemy as an ODBC Data Source
If you have not already, first specify connection properties in an ODBC data source name (DSN). This is the last step of the driver installation. You can use the Microsoft ODBC Data Source Administrator to create and configure ODBC DSNs. To publish Power BI reports from Power BI Desktop to Power BI Report Server, you will need to install the ODBC Driver on both the client (desktop) and server machines, using the same name for the DSN on each machine.
Start by setting the Profile connection property to the location of the Alchemy Profile on disk (e.g. C:\profiles\Alchemy.apip). Next, set the ProfileSettings connection property to the connection string for Alchemy (see below).
Alchemy API Profile Settings
Alchemy uses API key authentication. The API key is supplied in the request URL path. To obtain an API key:
- Sign in to your Alchemy account at https://dashboard.alchemy.com.
- Open an existing app or create a new one.
- Copy the app's API key from the API Key dialog.
After obtaining your API key, set the following connection properties:
- AuthScheme: Set this to APIKey.
- Network: Optional. The blockchain network slug for NFT API requests (for example, eth-mainnet, base-mainnet, polygon-mainnet). Defaults to eth-mainnet.
Set the following in the ProfileSettings connection property:
- APIKey: Set this to your Alchemy app API key.
When you configure the DSN, you may also want to set the Max Rows connection property. This will limit the number of rows returned, which is especially helpful for improving performance when designing reports and visualizations.
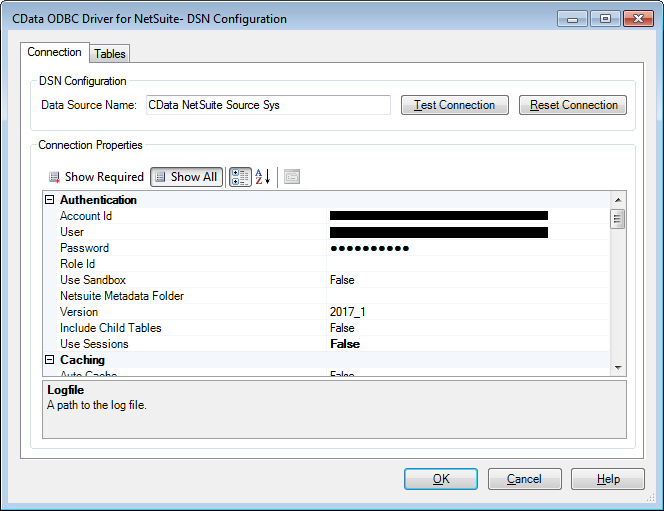
After creating a DSN, follow the steps below to connect to the Alchemy DSN from Power BI Desktop:
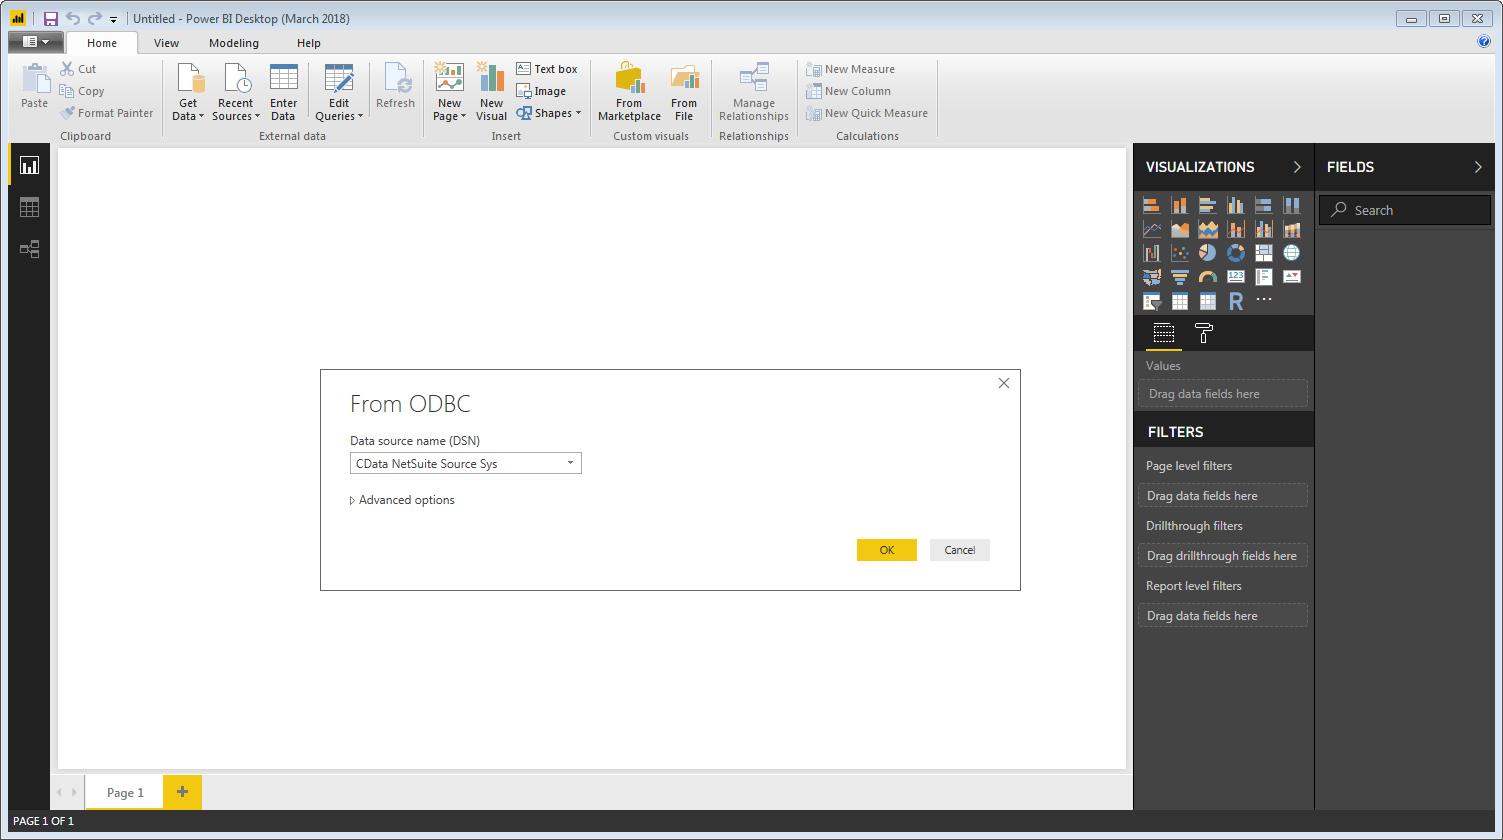
- Open Power BI Desktop and click Get Data -> ODBC. To start Power BI Desktop from PowerBI.com, click the download button and then click Power BI Desktop.
- Select a System DSN in the menu (necessary to publish to a Power BI Report Server). If you know the SQL query you want to use to import, expand the Advanced Options node and enter the query in the SQL Statement box.
- Select tables in the Navigator dialog.
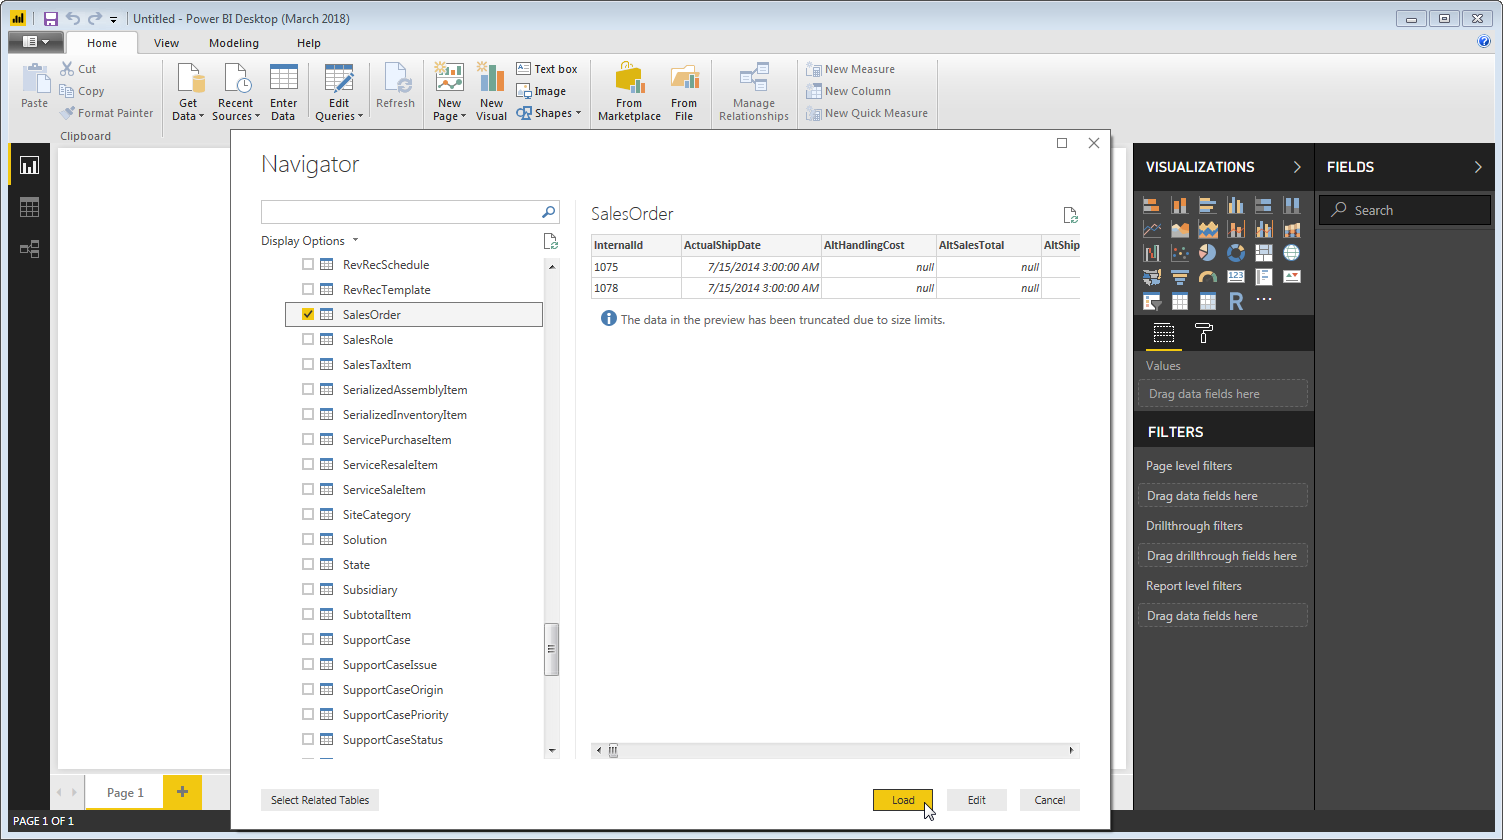
Click Edit to edit the query. The table you imported is displayed in the Query Editor. In the Query Editor, you can enrich your local copy of Alchemy data with other data sources, pivot Alchemy columns, and more. Power BI detects each column's data type from the Alchemy metadata retrieved by the driver.
Power BI records your modifications to the query in the Applied Steps section, adjusting the underlying data retrieval query that is executed to the remote Alchemy data. When you click Close and Apply, Power BI executes the data retrieval query.
Otherwise, click Load to pull the data into Power BI.
Create Data Visualizations
After pulling the data into Power BI, you can create data visualizations in the Report view by dragging fields from the Fields pane onto the canvas. Follow the steps below to create a pie chart:
- Select the pie chart icon in the Visualizations pane.
- Select a dimension in the Fields pane, for example, Address.
- Select a measure in the Name in the Fields pane, for example, Name. You can modify the visualization and the data used with the following techniques:
- Change sort options by clicking the ellipsis (...) button for the chart. Options to select the sort column and change the sort order are displayed.
- Use both highlighting and filtering to focus on data. Filtering removes unfocused data from visualizations; highlighting dims unfocused data. Highlight fields by clicking them.
- Apply filters at the page level, at the report level, or to a single visualization by dragging fields onto the Filters pane. To filter on the field's value, select one of the values that are displayed in the Filters pane.
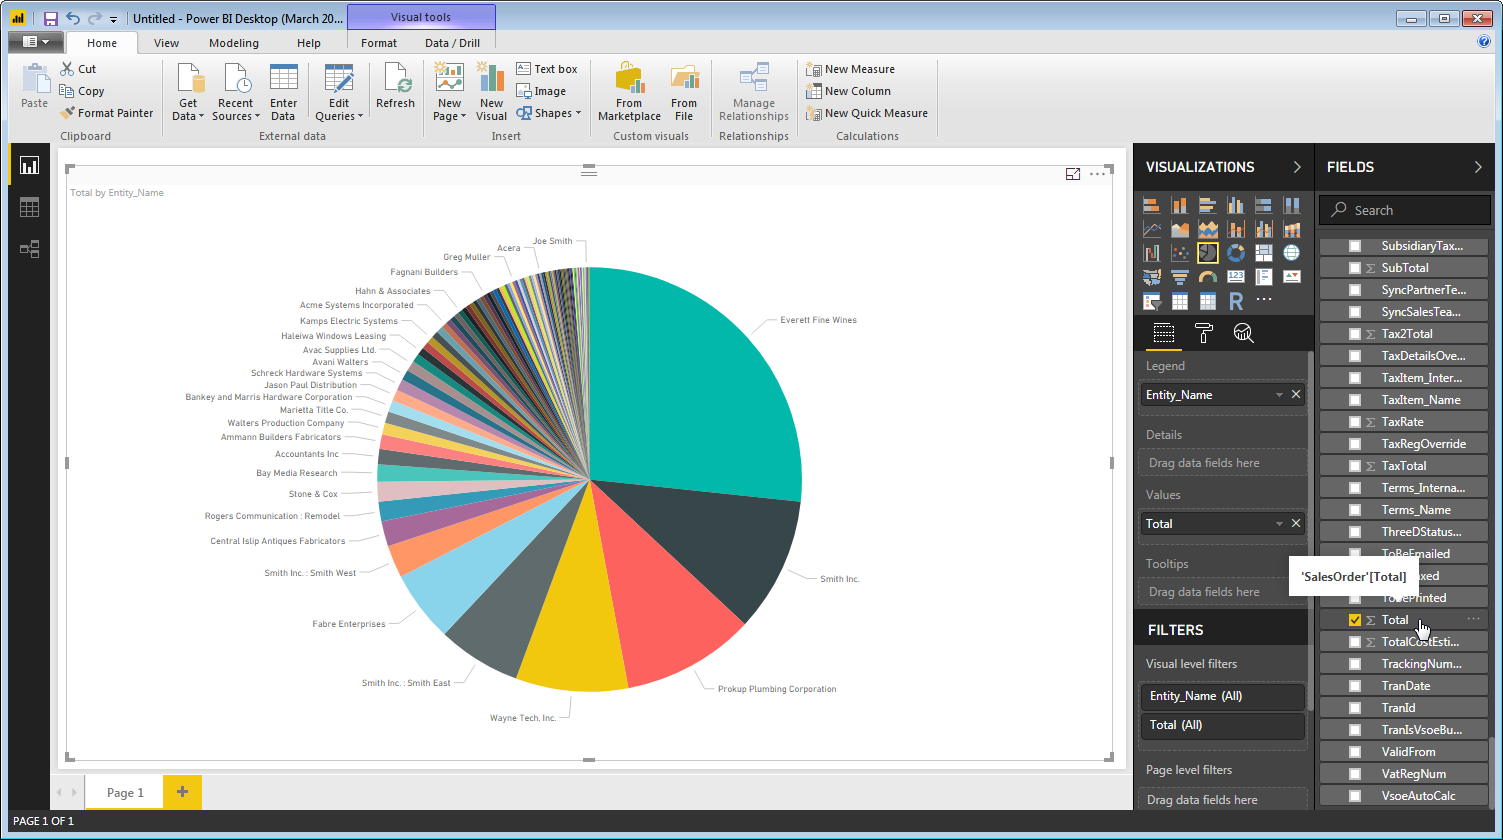
- Click Refresh to synchronize your report with any changes to the data and save your Power BI report to the client machine.
Upload Alchemy Data Reports to Power BI Report Server
You can share reports based on ODBC data sources with other Power BI users in your organization using a Power BI Report Server.
- Install and configure the ODBC Driver for Alchemy on the report server (see the instructions above).
- Log into the report server (typically found at http://MYSERVER/reports), click to upload a new report and select the report you just saved.
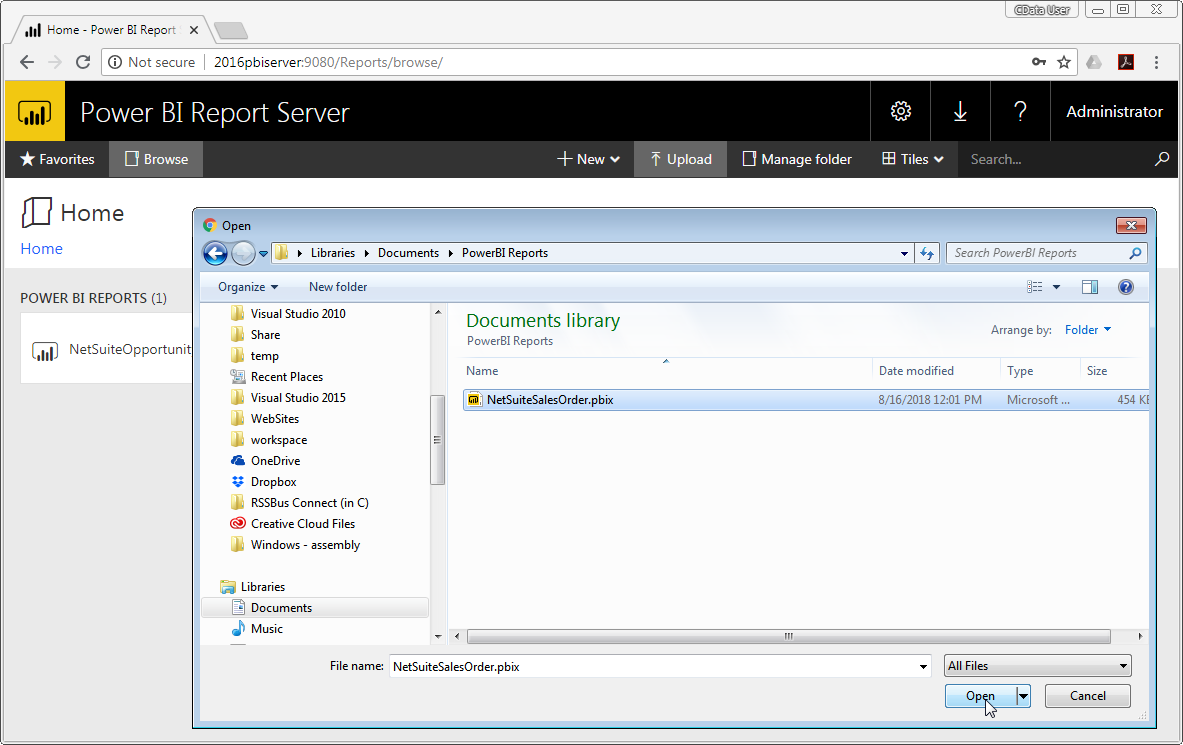
- View the Alchemy report from any machine with access to the Report Server.