Explore Geographical Relationships in BugHerd Data with Power Map

The CData ODBC Driver for BugHerd is easy to set up and use with self-service analytics solutions like Power BI: Microsoft Excel provides built-in support for the ODBC standard. This article shows how to load the current BugHerd data into Excel and start generating location-based insights on BugHerd data in Power Map.
Create an ODBC Data Source for BugHerd
If you have not already, first specify connection properties in an ODBC DSN (data source name). This is the last step of the driver installation. You can use the Microsoft ODBC Data Source Administrator to create and configure ODBC DSNs.
Start by setting the Profile connection property to the location of the BugHerd Profile on disk (e.g. C:\profiles\BugHerd.apip). Next, set the ProfileSettings connection property to the connection string for BugHerd (see below).
BugHerd API Profile Settings
BugHerd uses HTTP Basic authentication with an API key as the username. To obtain an API key:
- Sign in to your BugHerd account at https://www.bugherd.com
- Navigate to Settings > General Settings
- Locate the API Key section and copy the generated key
After obtaining your API key, set the following connection properties:
- AuthScheme: Set this to APIKey.
Set the following in the ProfileSettings connection property:
- APIKey: Set this to your BugHerd API key. The driver uses the key as the Basic auth username and sets the password internally to the literal value 'x' as required by BugHerd.
When you configure the DSN, you may also want to set the Max Rows connection property. This will limit the number of rows returned, which is especially helpful for improving performance when designing reports and visualizations.
When you configure the DSN, you may also want to set the Max Rows connection property. This will limit the number of rows returned, which is especially helpful for improving performance when designing reports and visualizations.
Import BugHerd Data into Excel
You can import data into Power Map either from an Excel spreadsheet or from Power Pivot. For a step-by-step guide to use either method to import BugHerd data, see the "Using the ODBC Driver" section in the help documentation.
Geocode BugHerd Data
After importing the BugHerd data into an Excel spreadsheet or into PowerPivot, you can drag and drop BugHerd entities in Power Map. To open Power Map, click any cell in the spreadsheet and click Insert -> Map.
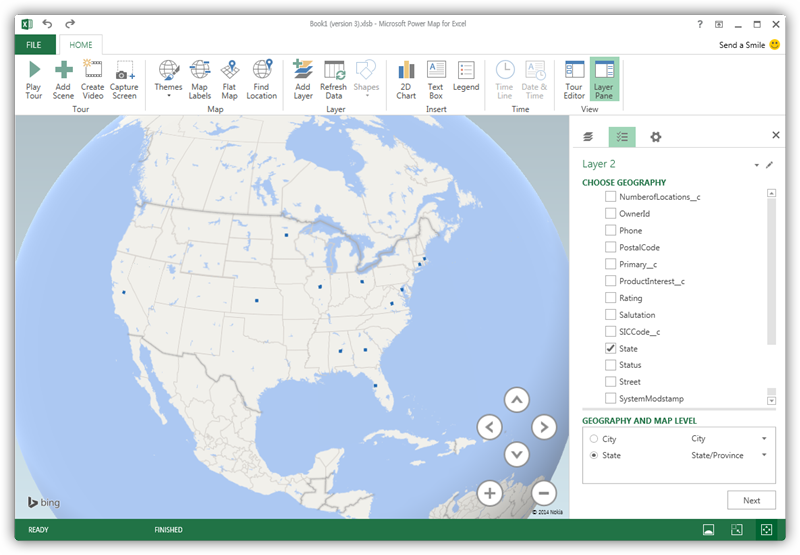
In the Choose Geography menu, Power Map detects the columns that have geographic information. In the Geography and Map Level menu in the Layer Pane, you can select the columns you want to work with. Power Map then plots the data. A dot represents a record that has this value. When you have selected the geographic columns you want, click Next.
Select Measures and Categories
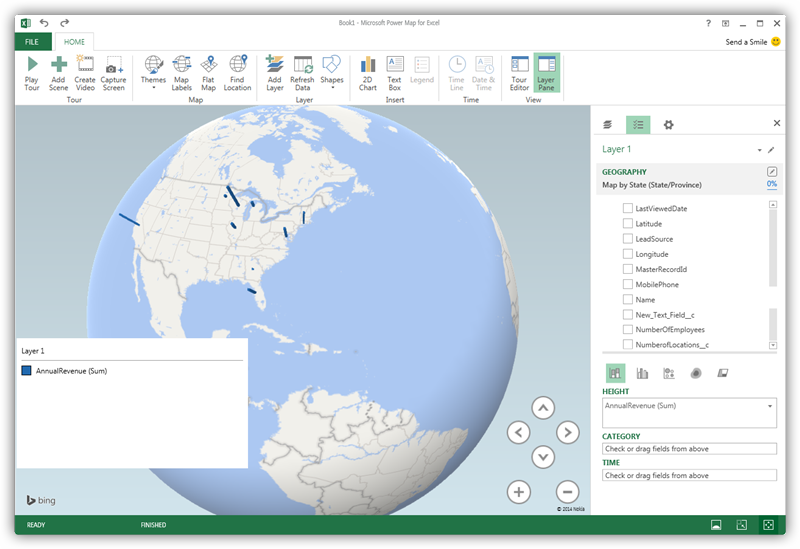
You can then simply select columns: Measures and categories are automatically detected. The available chart types are Stacked Column, Clustered Column, Bubble, Heat Map, and Region.