DataBind Carbone Data to the DevExpress Data Grid

The CData API Driver for ADO.NET incorporates conventional ADO.NET data access components compatible with third-party controls. You can adhere to the standard ADO.NET data binding procedures to establish two-way access to real-time data through UI controls. This article will demonstrate the utilization of CData components for data binding with DevExpress UI Controls (Windows Forms and Web controls), specifically binding to a chart that visualizes live data.
Start by setting the Profile connection property to the location of the Carbone Profile on disk (e.g. C:\profiles\Carbone.apip). Next, set the ProfileSettings connection property to the connection string for Carbone (see below).
Carbone API Profile Settings
Carbone uses API key authentication via a Bearer token in the Authorization header. To obtain an API key:
- Log in to your Carbone account at https://account.carbone.io
- Copy the API key shown on the account home page
After obtaining your API key, set the following connection properties:
- AuthScheme: Set this to APIKey.
- APIKey: Set this to your Carbone API key (Bearer token).
- CarboneVersion: (Optional) The major version of the Carbone API to target via the carbone-version request header. Defaults to 5. Accepted values: 5, 4, 3, staging.
Windows Forms Controls
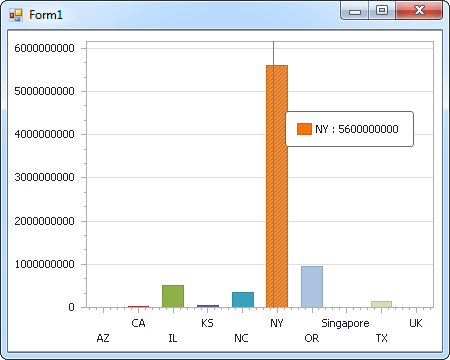
The code below shows how to populate a DevExpress chart with Carbone data. The APIDataAdapter binds to the Series property of the chart control. The Diagram property of the control defines the x- and y-axes as the column names.
using (APIConnection connection = new APIConnection(
"Profile=C:\profiles\Carbone.apip;AuthScheme=APIKey;APIKey=your_api_key;")) {
  APIDataAdapter dataAdapter = new APIDataAdapter(
  "SELECT Id, Name FROM Templates WHERE Category = 'Invoices'", connection);

  DataTable table = new DataTable();
  dataAdapter.Fill(table);
  DevExpress.XtraCharts.Series series = new DevExpress.XtraCharts.Series();
  chartControl1.Series.Add(series);
  series.DataSource = table;
  series.ValueDataMembers.AddRange(new string[] { "Name" });
  series.ArgumentScaleType = DevExpress.XtraCharts.ScaleType.Qualitative;
  series.ArgumentDataMember = "Id";
  series.ValueScaleType = DevExpress.XtraCharts.ScaleType.Numerical;
  chartControl1.Legend.Visibility = DevExpress.Utils.DefaultBoolean.False;
  ((DevExpress.XtraCharts.SideBySideBarSeriesView)series.View).ColorEach = true;
}
Web Controls
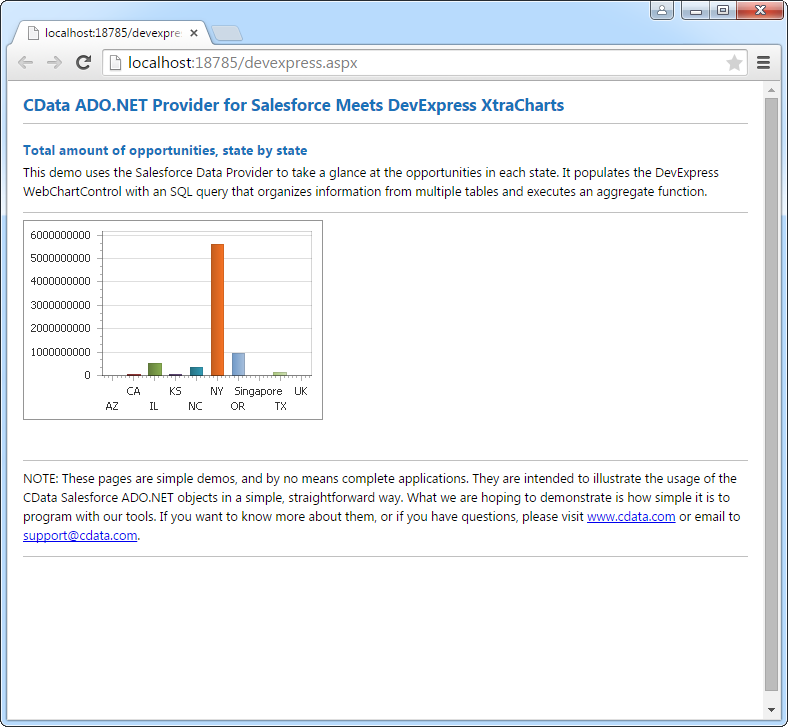
The code below shows how to populate a DevExpress Web control with Carbone data. The APIDataAdapter binds to the Series property of the chart; the Diagram property defines the x- and y-axes as the column names.
using DevExpress.XtraCharts;

using (APIConnection connection = new APIConnection(
"Profile=C:\profiles\Carbone.apip;AuthScheme=APIKey;APIKey=your_api_key;"))
{
  APIDataAdapter APIDataAdapter1 = new APIDataAdapter("SELECT Id, Name FROM Templates WHERE Category = 'Invoices'", connection);
  DataTable table = new DataTable();
  APIDataAdapter1.Fill(table);
  DevExpress.XtraCharts.Series series = new Series("Series1", ViewType.Bar);
  WebChartControl1.Series.Add(series);
  series.DataSource = table;
  series.ValueDataMembers.AddRange(new string[] { "Name" });
  series.ArgumentScaleType = ScaleType.Qualitative;
  series.ArgumentDataMember = "Id";
  series.ValueScaleType = ScaleType.Numerical;
  ((DevExpress.XtraCharts.SideBySideBarSeriesView)series.View).ColorEach = true;
}