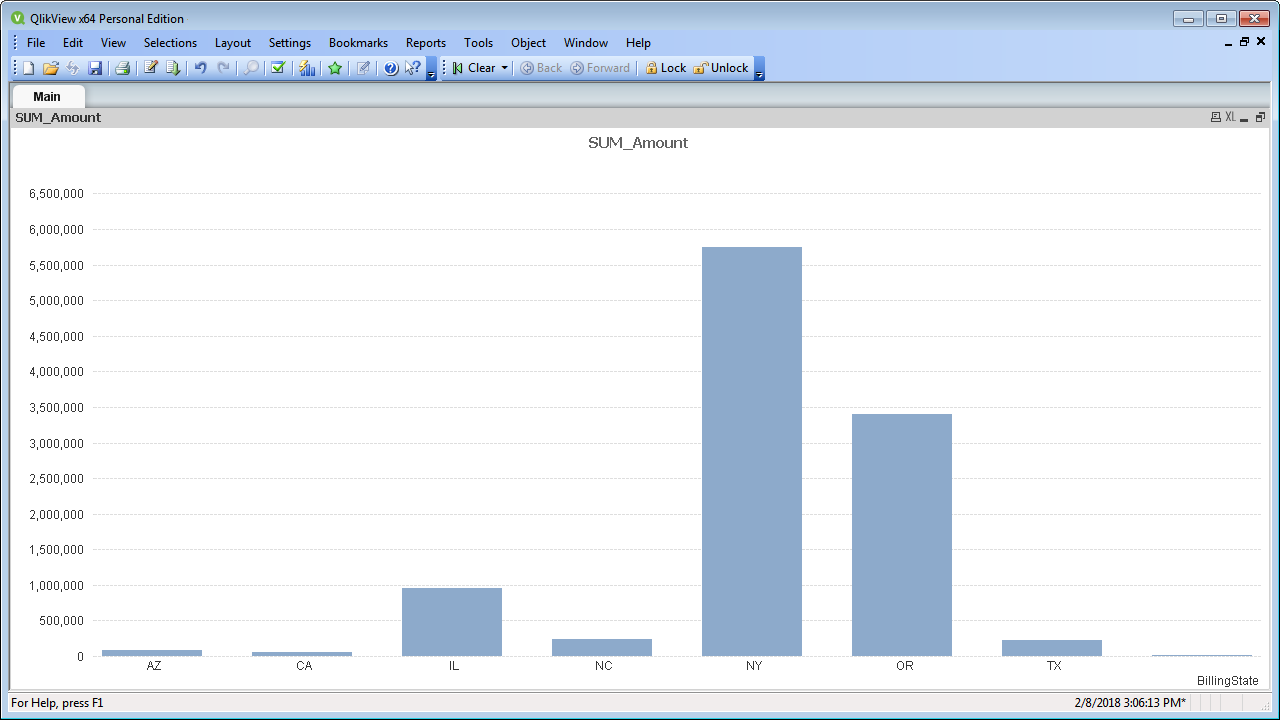
Connect to and Query Clarifai Data in QlikView over ODBC

The CData ODBC drivers expand your ability to work with data from hundreds of data sources. QlikView is a business discovery platform that provides self-service BI for all business users in an organization. This article outlines simple steps to connect to Clarifai data using the CData ODBC driver and create data visualizations in QlikView.
The CData ODBC drivers offer unmatched performance for interacting with live Clarifai data in QlikView due to optimized data processing built into the driver. When you issue complex SQL queries from QlikView to Clarifai, the driver pushes supported SQL operations, like filters and aggregations, directly to Clarifai and utilizes the embedded SQL engine to process unsupported operations (often SQL functions and JOIN operations) client-side. With built-in dynamic metadata querying, you can visualize and analyze Clarifai data using native QlikView data types.
Connect to Clarifai as an ODBC Data Source
If you have not already, first specify connection properties in an ODBC DSN (data source name). This is the last step of the driver installation. You can use the Microsoft ODBC Data Source Administrator to create and configure ODBC DSNs.
Start by setting the Profile connection property to the location of the Clarifai Profile on disk (e.g. C:\profiles\Clarifai.apip). Next, set the ProfileSettings connection property to the connection string for Clarifai (see below).
Clarifai API Profile Settings
Clarifai uses Personal Access Tokens (PATs) for authentication. To obtain a PAT:
- Log in to your Clarifai account at https://clarifai.com.
- Navigate to your profile settings and select Security.
- Click Create Personal Access Token.
- Select the required scopes and click Create Token.
- Copy the generated token (it will only be shown once).
After obtaining your Personal Access Token, set the following connection properties:
- AuthScheme: Set this to APIKey.
Set the following in the ProfileSettings connection property:
- APIKey: Set this to your Clarifai Personal Access Token (PAT).
When you configure the DSN, you may also want to set the Max Rows connection property. This will limit the number of rows returned, which is especially helpful for improving performance when designing reports and visualizations.
Populate a Chart with Clarifai Data
The steps below supply the results of an SQL query to a visualization in QlikView. In this article, you will create a bar chart with the query below:
SELECT Id, Name FROM Apps WHERE UserId = 'my-user-id'
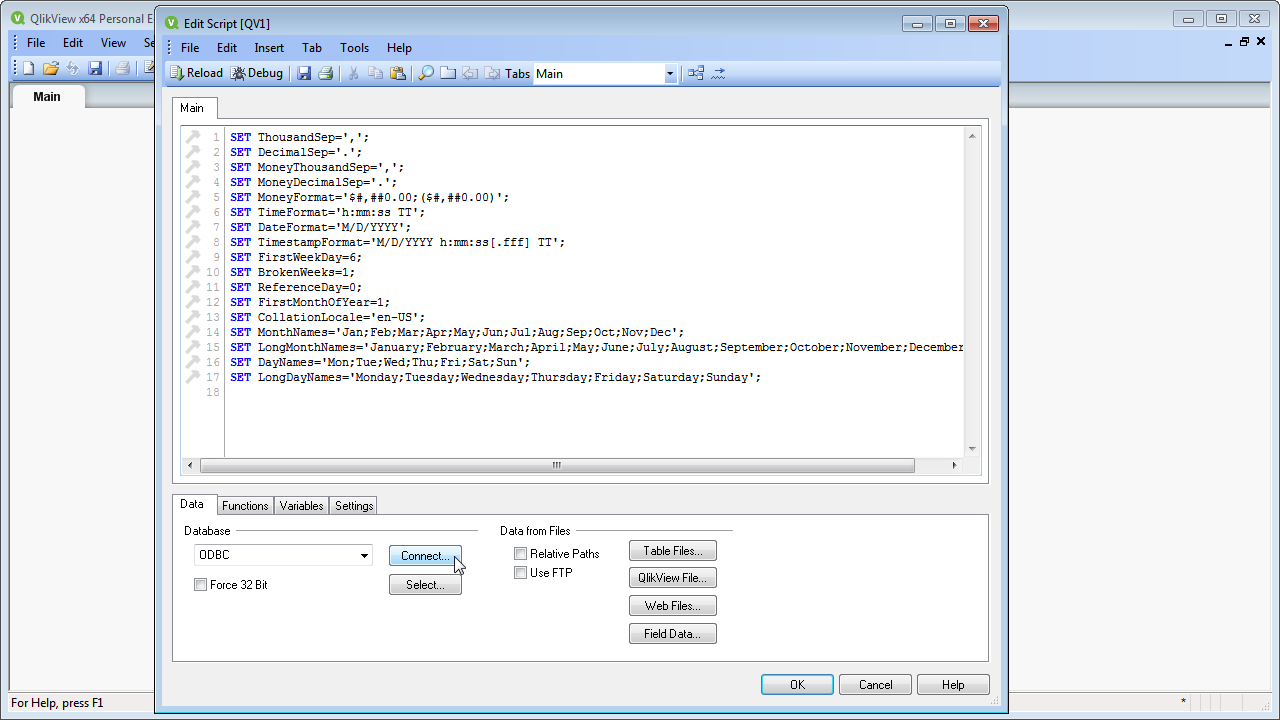
- Click File -> Edit Script (or click the Edit Script button in the Toolbar).
- On the Data tab, select ODBC in the Database menu and click Connect.
- Select the DSN (CData API Sys) in the resulting dialog.
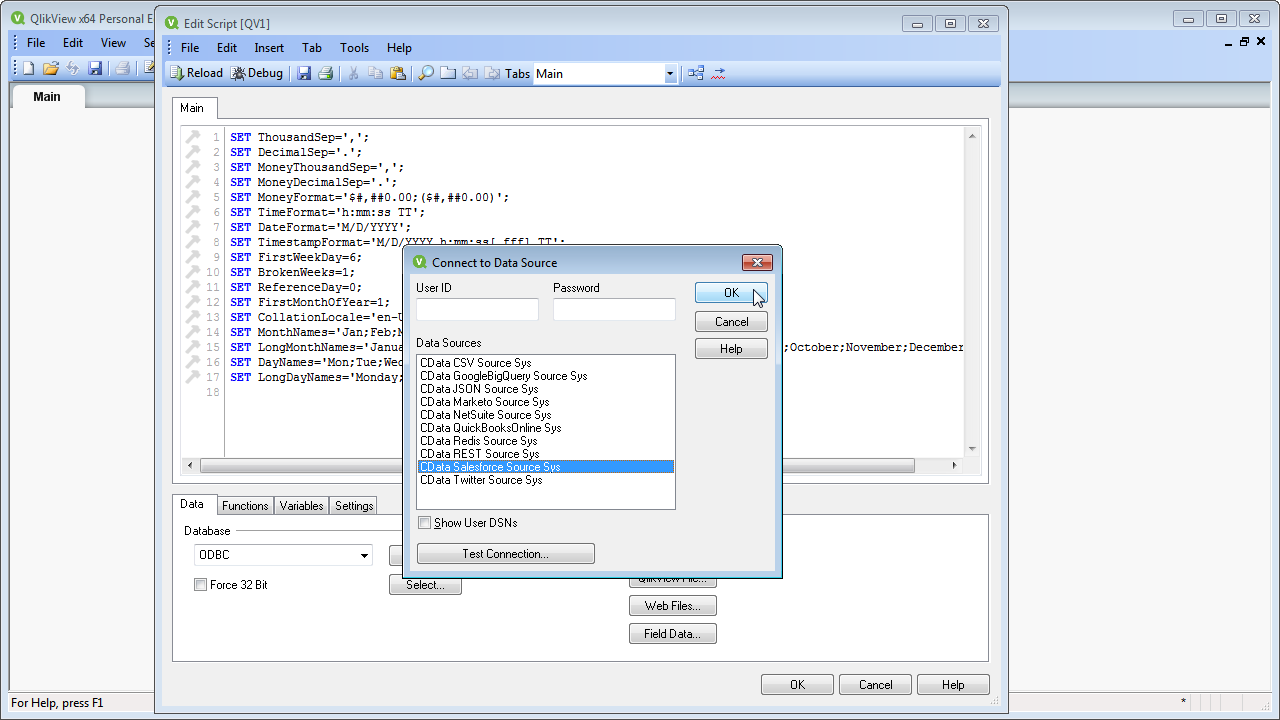 A command like the following is generated:
ODBC CONNECT TO [CData API Sys]; - Enter the SQL query directly into the script with the SQL command (or click Select to build the query in the SELECT statement wizard).
SQL SELECT Id, Name FROM Apps WHERE UserId = 'my-user-id';Where possible, the SQL operations in the query, like filters and aggregations, will be pushed down to Clarifai, while any unsupported operations (which can include SQL functions and JOIN operations) will be managed client-side by the CData SQL engine embedded in the driver.
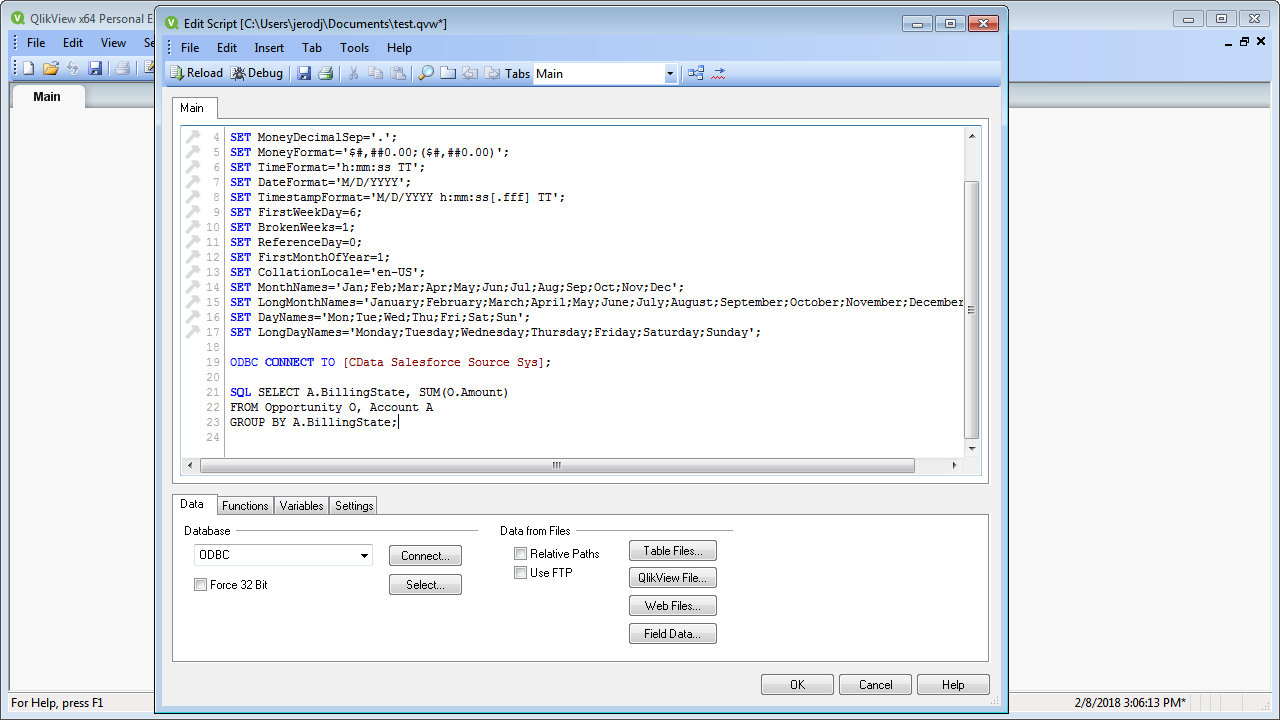
- Close the script editor and reload the document to execute the script.
- Click Tools -> Quick Chart Wizard. In the wizard, select the chart type. This example uses a bar chart. When building the chart, you have access to the fields from Clarifai, typed appropriately for QlikView, thanks to built-in dynamic metadata querying.
- When defining Dimensions, select Id in the First Dimension menu.
- When defining Expressions, click the summary function you want and select Name in the menu.
Finish the wizard to generate the chart. The CData ODBC Driver for Clarifai connects to live Clarifai data, so the chart can be refreshed to see real-time changes. Live connections are possible and effective, thanks to the high-performance data processing native to CData ODBC Drivers.