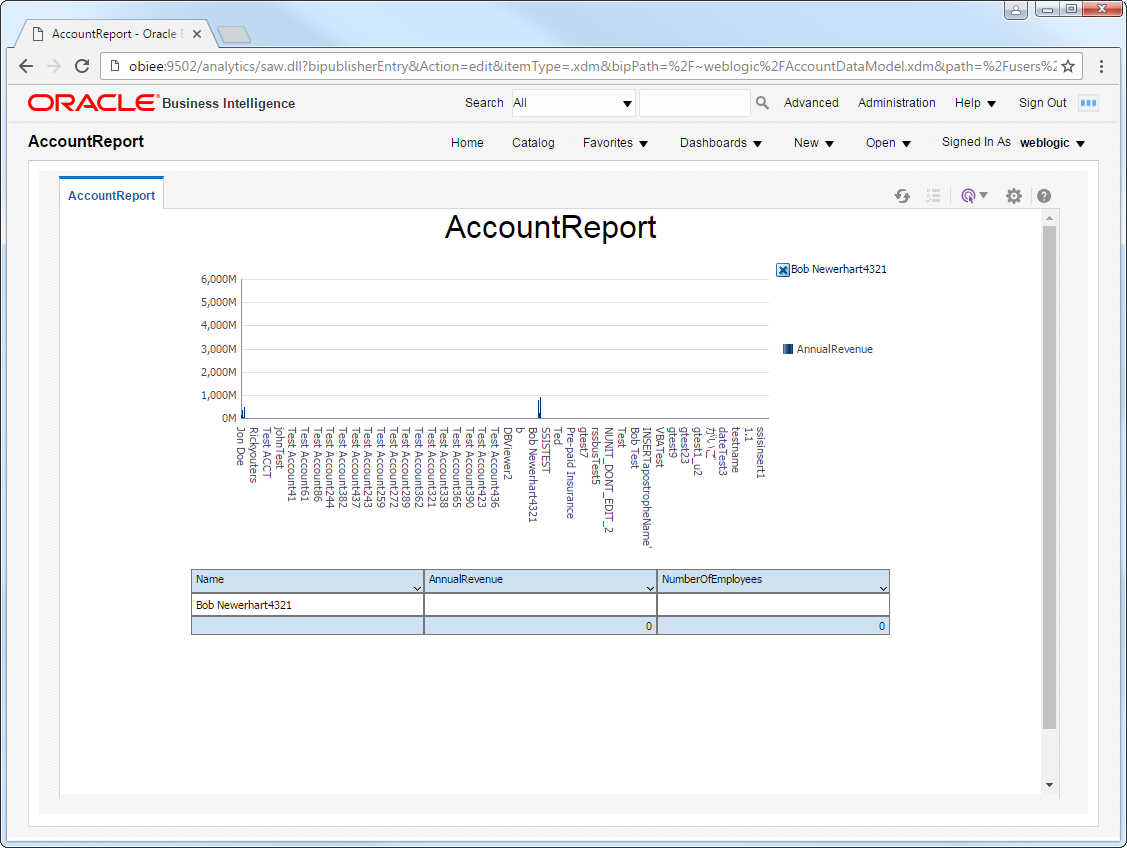
Databox Reporting in OBIEE with the Databox JDBC Driver

The CData JDBC Driver for Databox is a standard database driver that can integrate real-time access to Databox data into your Java-based reporting server. This article shows how to deploy the driver to Oracle Business Intelligence Enterprise Edition (OBIEE) and create reports on Databox data that reflect any changes.
Deploy the JDBC Driver
Follow the steps below to add the JDBC driver to WebLogic's classpath.
For WebLogic 12.2.1, simply place the driver JAR and .lic file into DOMAIN_HOME\lib; for example, ORACLE_HOME\user_projects\domains\MY_DOMAIN\lib. These files will be added to the server classpath at startup.
You can also manually add the driver to the classpath: This is required for earlier versions. Prepend the following to PRE_CLASSPATH in setDomainEnv.cmd (Windows) or setDomainEnv.sh (Unix). This script is located in the bin subfolder of the folder for that domain. For example: ORACLE_HOME\user_projects\domains\MY_DOMAIN\bin.
set PRE_CLASSPATH=your-installation-directory\lib\cdata.jdbc.api.jar;%PRE_CLASSPATH%
Restart all servers; for example, run the stop and start commands in DOMAIN_HOME\bitools\bin.
Create a JDBC Data Source for Databox
After deploying the JDBC driver, you can create a JDBC data source from BI Publisher.
- Log into BI Publisher, at the URL http://localhost:9502/analytics, for example, and click Administration -> Manage BI Publisher.
- Click JDBC Connection -> Add Data Source.
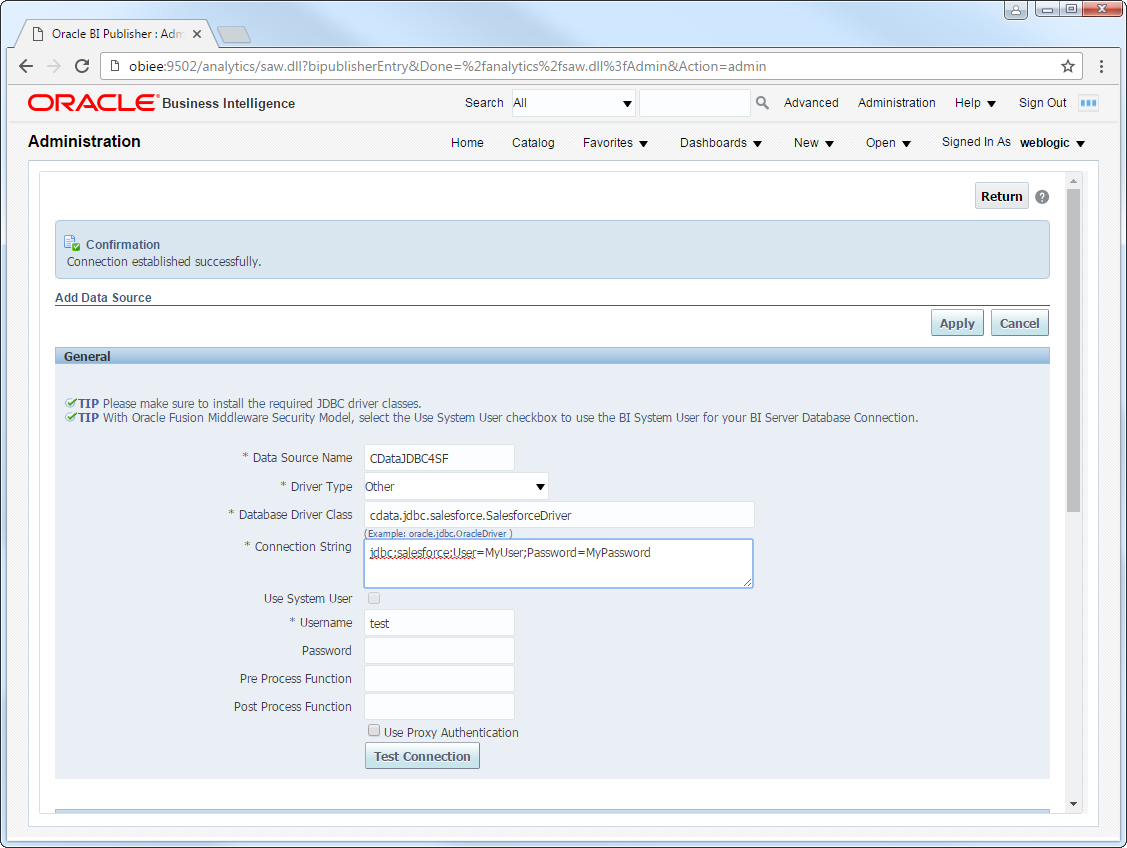
- Enter the following information:
- Data Source Name: Enter the name that users will create connections to in their reports.
- Driver Type: Select Other.
- Database DriverClass: Enter the driver class, cdata.jdbc.api.APIDriver.
- Connection String: Enter the JDBC URL.
Start by setting the Profile connection property to the location of the Databox Profile on disk (e.g. C:\profiles\Databox.apip). Next, set the ProfileSettings connection property to the connection string for Databox (see below).
Databox API Profile Settings
To use the Databox API, you need to generate a personal access key from your Databox account. Navigate to the Databox account settings under Data Manager and generate an API key (prefixed with pak_).
After setting the following connection properties, you are ready to connect:
- AuthScheme: Set this to APIKey.
- APIKey: Set this to your Databox personal access key.
Built-in Connection String Designer
For assistance in constructing the JDBC URL, use the connection string designer built into the Databox JDBC Driver. Either double-click the JAR file or execute the jar file from the command-line.
java -jar cdata.jdbc.api.jarFill in the connection properties and copy the connection string to the clipboard.
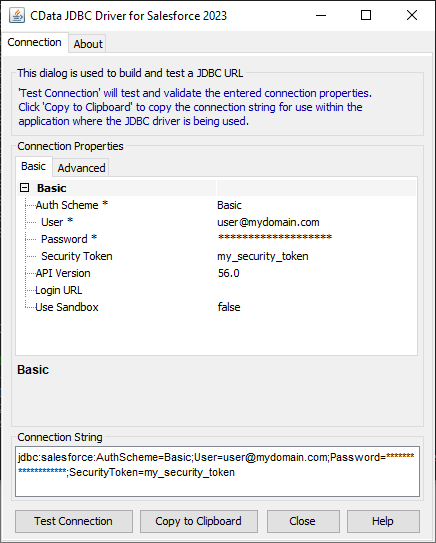
When you configure the JDBC URL, you may also want to set the Max Rows connection property. This will limit the number of rows returned, which is especially helpful for improving performance when designing reports and visualizations.
A typical JDBC URL is below:
jdbc:api:Profile=C:\profiles\Databox.apip;AuthScheme=APIKey;ProfileSettings='APIKey=your_api_key'; - Username: Enter the username.
- Password: Enter the password.
- In the Security section, select the allowed user roles.
Create Real-Time Databox Reports
You can now create reports and analyses based on real-time Databox data. Follow the steps below to use the standard report wizard to create an interactive report that reflects any changes to Databox data.
- On the global header, click New -> Data Model.
- On the Diagram tab, select SQL query in the menu.
- Enter a name for the query and in the Data Source menu select the Databox JDBC data source you created.
- Select standard SQL and enter a query like the following:
SELECT Id, Title FROM Datasets WHERE DataSourceId = '4976164'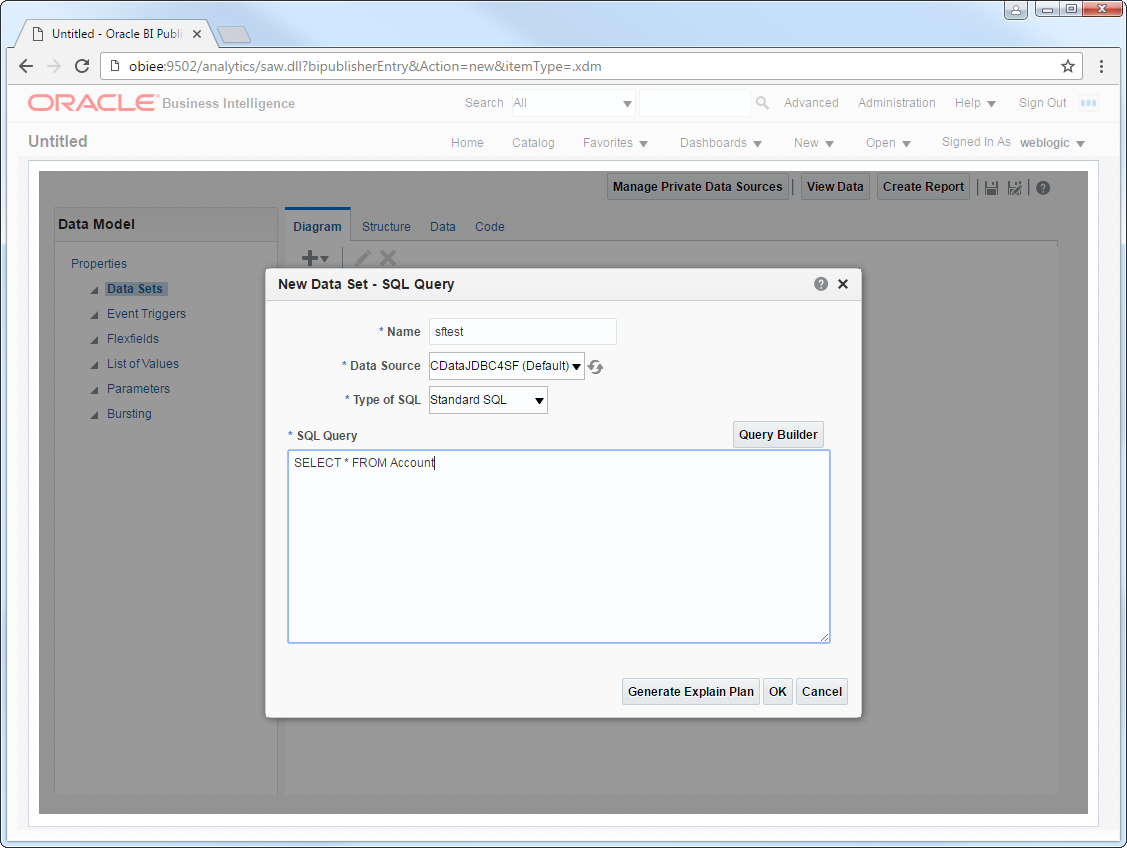
- Click View Data to generate the sample data to be used as you build your report.
- Select the number of rows to include in the sample data, click View, and then click Save As Sample Data.
- Click Create Report -> Use Data Model.
- Select Guide Me and on the Select Layout page select the report objects you want to include. In this example we select Chart and Table.
- Drop a numeric column like Title onto the Drop Value Here box on the y-axis. Drop a dimension column like Id onto the Drop Label Here box on the x-axis.
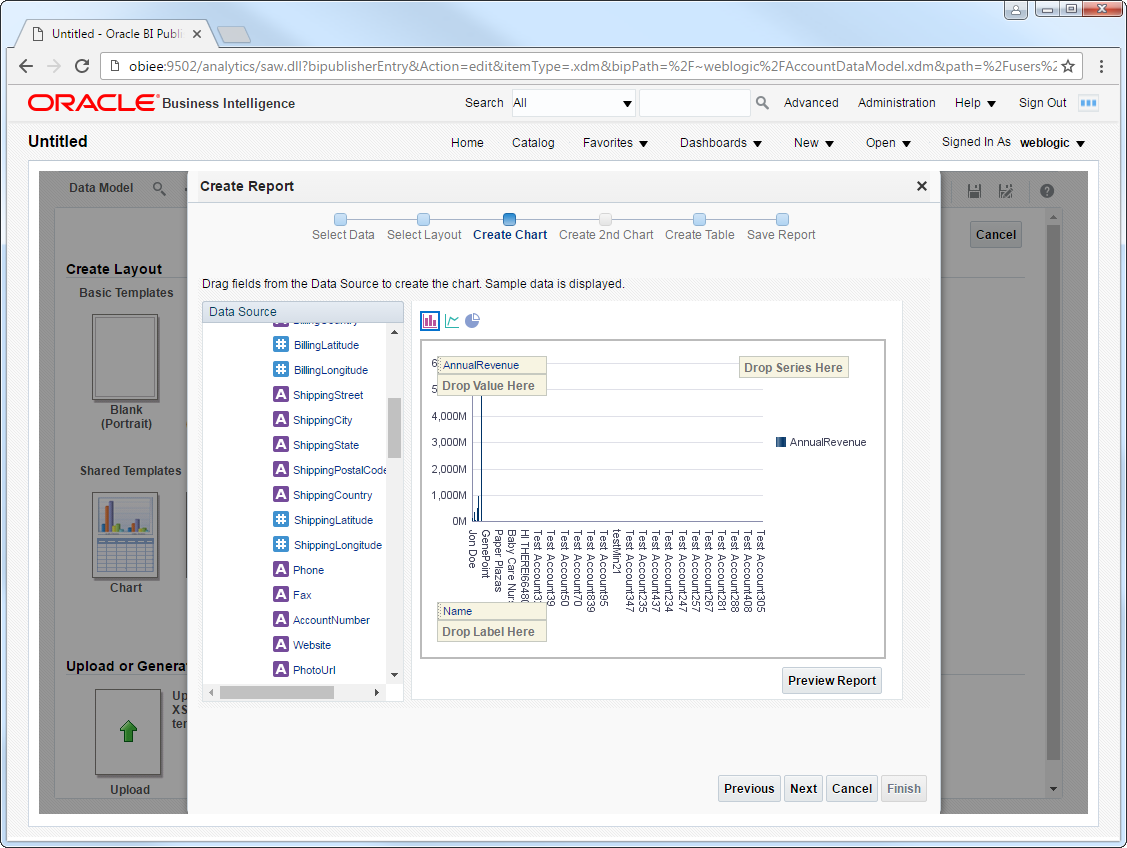
- Click Refresh to pick up any changes to the Databox data.