




Visualize JD Edwards Data in TIBCO Spotfire through ADO.NET

TIBCO Spotfire is a data visualization and business intelligence software developed by TIBCO Software Inc. It allows users to connect, visualize, and share insights from various data sources in real-time. Spotfire provides interactive dashboards, data analytics, and predictive analytics capabilities, enabling users to explore data, uncover trends, and make data-driven decisions. It is commonly used in businesses and organizations to analyze large datasets, gain valuable insights, and improve decision-making processes. Learn more at https://www.tibco.com/analytics.
In this article, we will guide you through the process of utilizing the CData ADO.NET Provider for JD Edwards within TIBCO Spotfire. You will learn how to establish a connection and build a basic dashboard.
- Add the CData ADO.NET data source by clicking Add Data Tables.
- Click Add -> Database.
- Select the provider and click Configure.
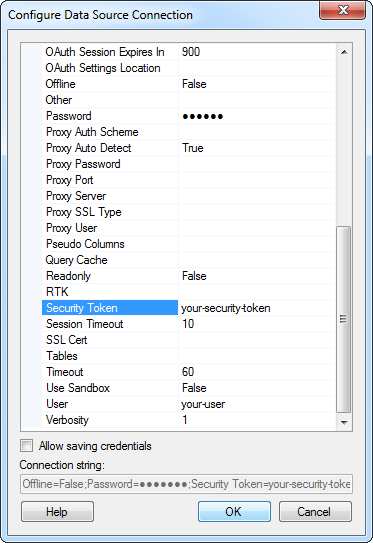
- Define the connection settings. Below is a typical connection string:
URL=https://your-jde-environment-app.example.com;User=admin;Password=myPassword;
The driver connects to JD Edwards through your Application Interface Services (AIS) Server. Set the following connection properties:
- URL: The base HTTPS URL of your AIS Server (e.g., https://jde-ais.example.com:8300).
- User: Your JD Edwards username.
- Password: Your JD Edwards password.
- Environment (optional): The JD Edwards environment to use (e.g., PD920 for production or DV920 for development). If not specified, the AIS Server's default environment is used.
- Role (optional): The JD Edwards role for the session. If not specified, the AIS Server's default role is used.
- DeviceName (optional): An identifier for the connecting device or application, used for auditing and logging on the AIS Server.
- Jasserver (optional): The specific Java Application Server (JAS) instance to route requests through, useful in clustered environments.
Choosing Which Data Is Exposed
JD Edwards organizes tables and business views by System Code, and the driver exposes each System Code as its own schema. Use these properties to control which schemas are available:
- DataModel: One or more ERP modules (comma-separated) whose System Codes are exposed as schemas, or All to expose every System Code in the connected instance. Defaults to FinancialManagement.
- SystemCodes: A comma-separated list of additional System Codes to expose alongside those from DataModel (e.g., 42,43).
When you connect, the driver sends your credentials to the AIS Server to obtain a session token and caches it. The driver requests a new token automatically before the session expires.
When you configure the connection, you may also want to set the Max Rows connection property. This will limit the number of rows returned, which is especially helpful for improving performance when designing reports and visualizations.
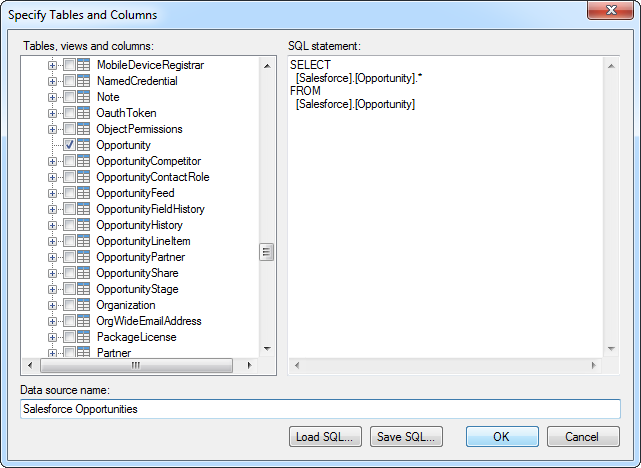
- Select the tables that you want to add to the dashboard. This example uses AccountsPayable.AccountLedger. You can also specify an SQL query. The driver supports the standard SQL syntax.
- If you want to work with the live data, click the Keep Data Table External option. This option enables your dashboards to reflect changes to the data in real time.
If you want to load the data into memory and process the data locally, click the Import Data Table option. This option is better for offline use or if a slow network connection is making your dashboard less interactive.
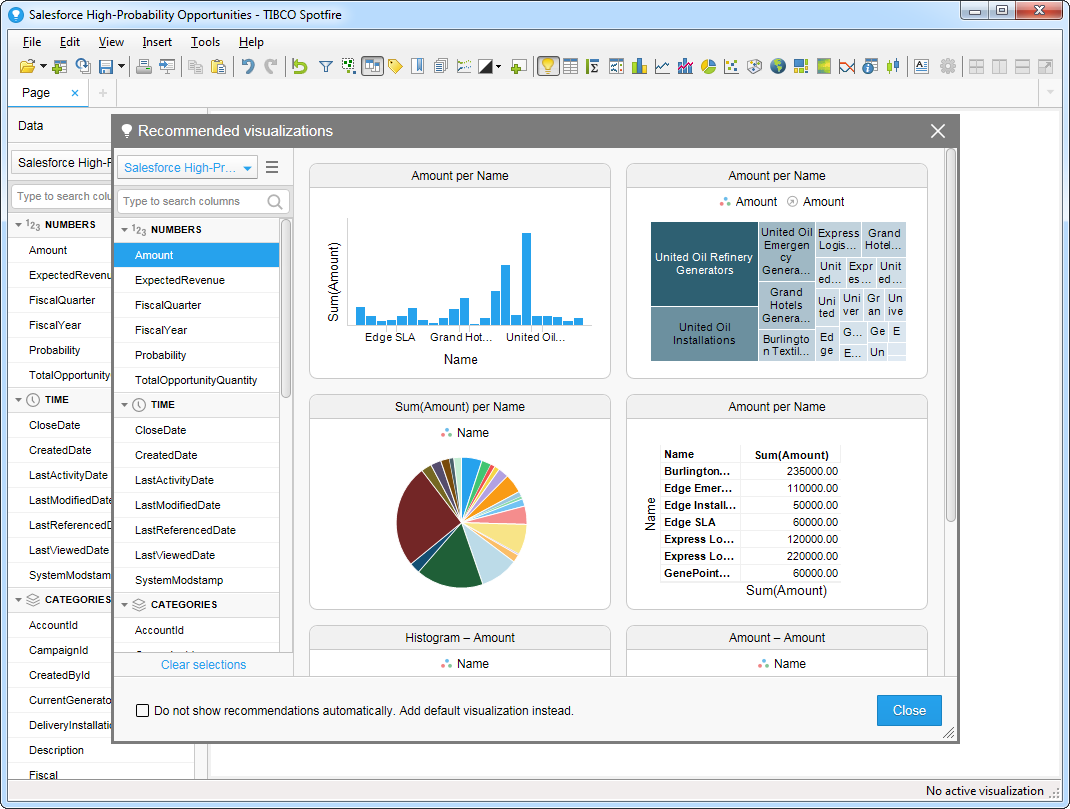
- After adding tables, the Recommended Visualizations wizard is displayed. When you select a table, Spotfire uses the column data types to detect number, time, and category columns. This example uses Amount in the Numbers section and DocumentNumber in the Categories section.
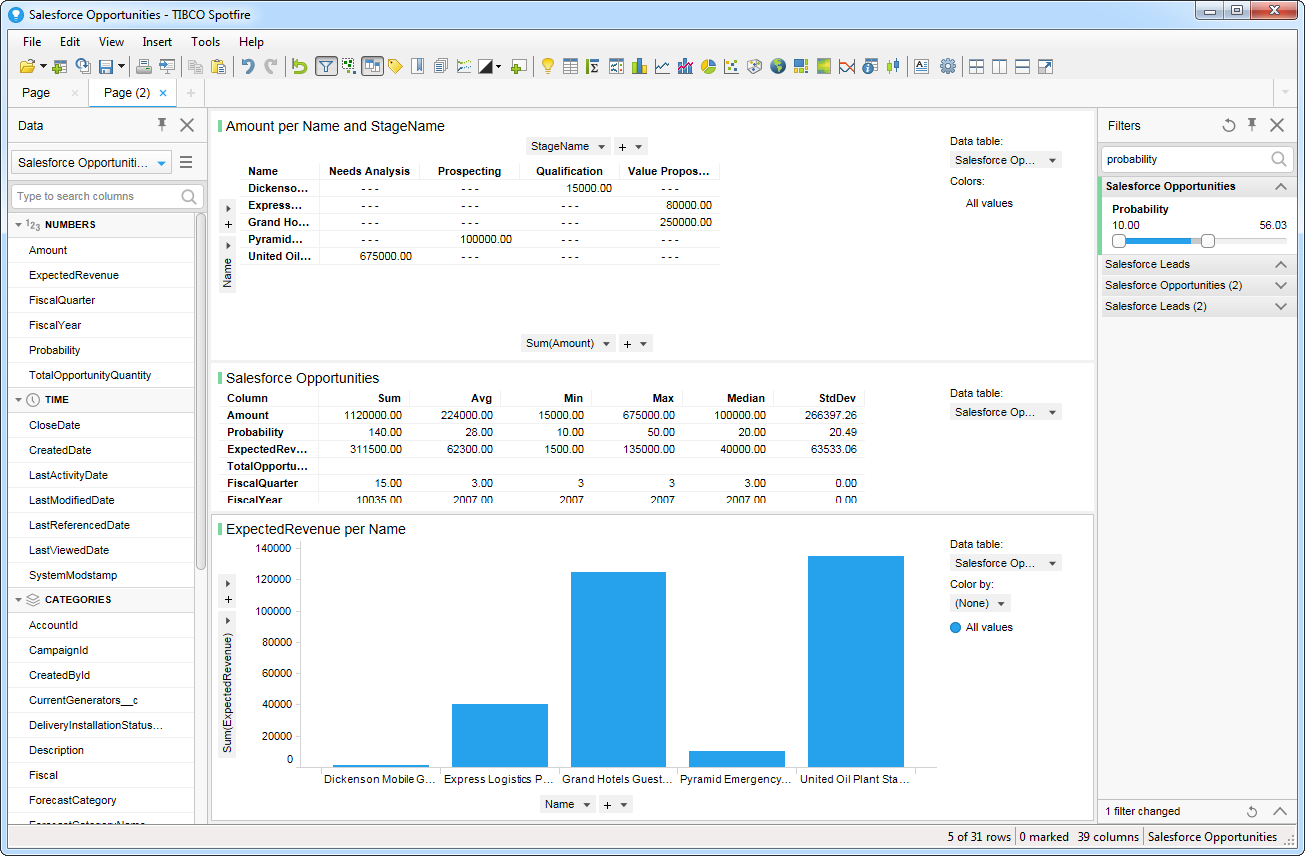
After adding several visualizations in the Recommended Visualizations wizard, you can make other modifications to the dashboard. For example, you can apply a filter: After clicking the Filter button, the available filters for each query are displayed in the Filters pane.
Ready to get started?
Download a free trial of the JD Edwards Data Provider to get started:
Download NowLearn more:
 JD Edwards ADO.NET Provider
Rapidly create and deploy powerful .NET applications that integrate with JD Edwards data including AccountLedger, ProposalofPayment, ContractRevenueSummary, EmployeeEnrollment, RentIncreaseAmounts, and more!