




Analyze JD Edwards Data in Looker

Looker is a business intelligence and big data analytics platform that helps you explore, analyze and share real-time business analytics. When paired with CData Connect AI, you get instant, cloud-to-cloud access to JD Edwards data for business applications. This article shows how to connect to JD Edwards in Connect AI and then connect to JD Edwards data in Looker.
CData Connect AI provides a pure cloud-to-cloud interface for JD Edwards, allowing you to build reports from live JD Edwards data in Looker — without replicating the data to a natively supported database. As you create applications to work with data, Looker generates SQL queries to gather data. Using optimized data processing out of the box, CData Connect AI pushes all supported SQL operations (filters, JOINs, etc.) directly to JD Edwards, leveraging server-side processing to quickly return the requested JD Edwards data.
Configure JD Edwards Connectivity for Looker
Connectivity to JD Edwards from Looker is made possible through CData Connect AI. To work with JD Edwards data from Looker, we start by creating and configuring a JD Edwards connection.
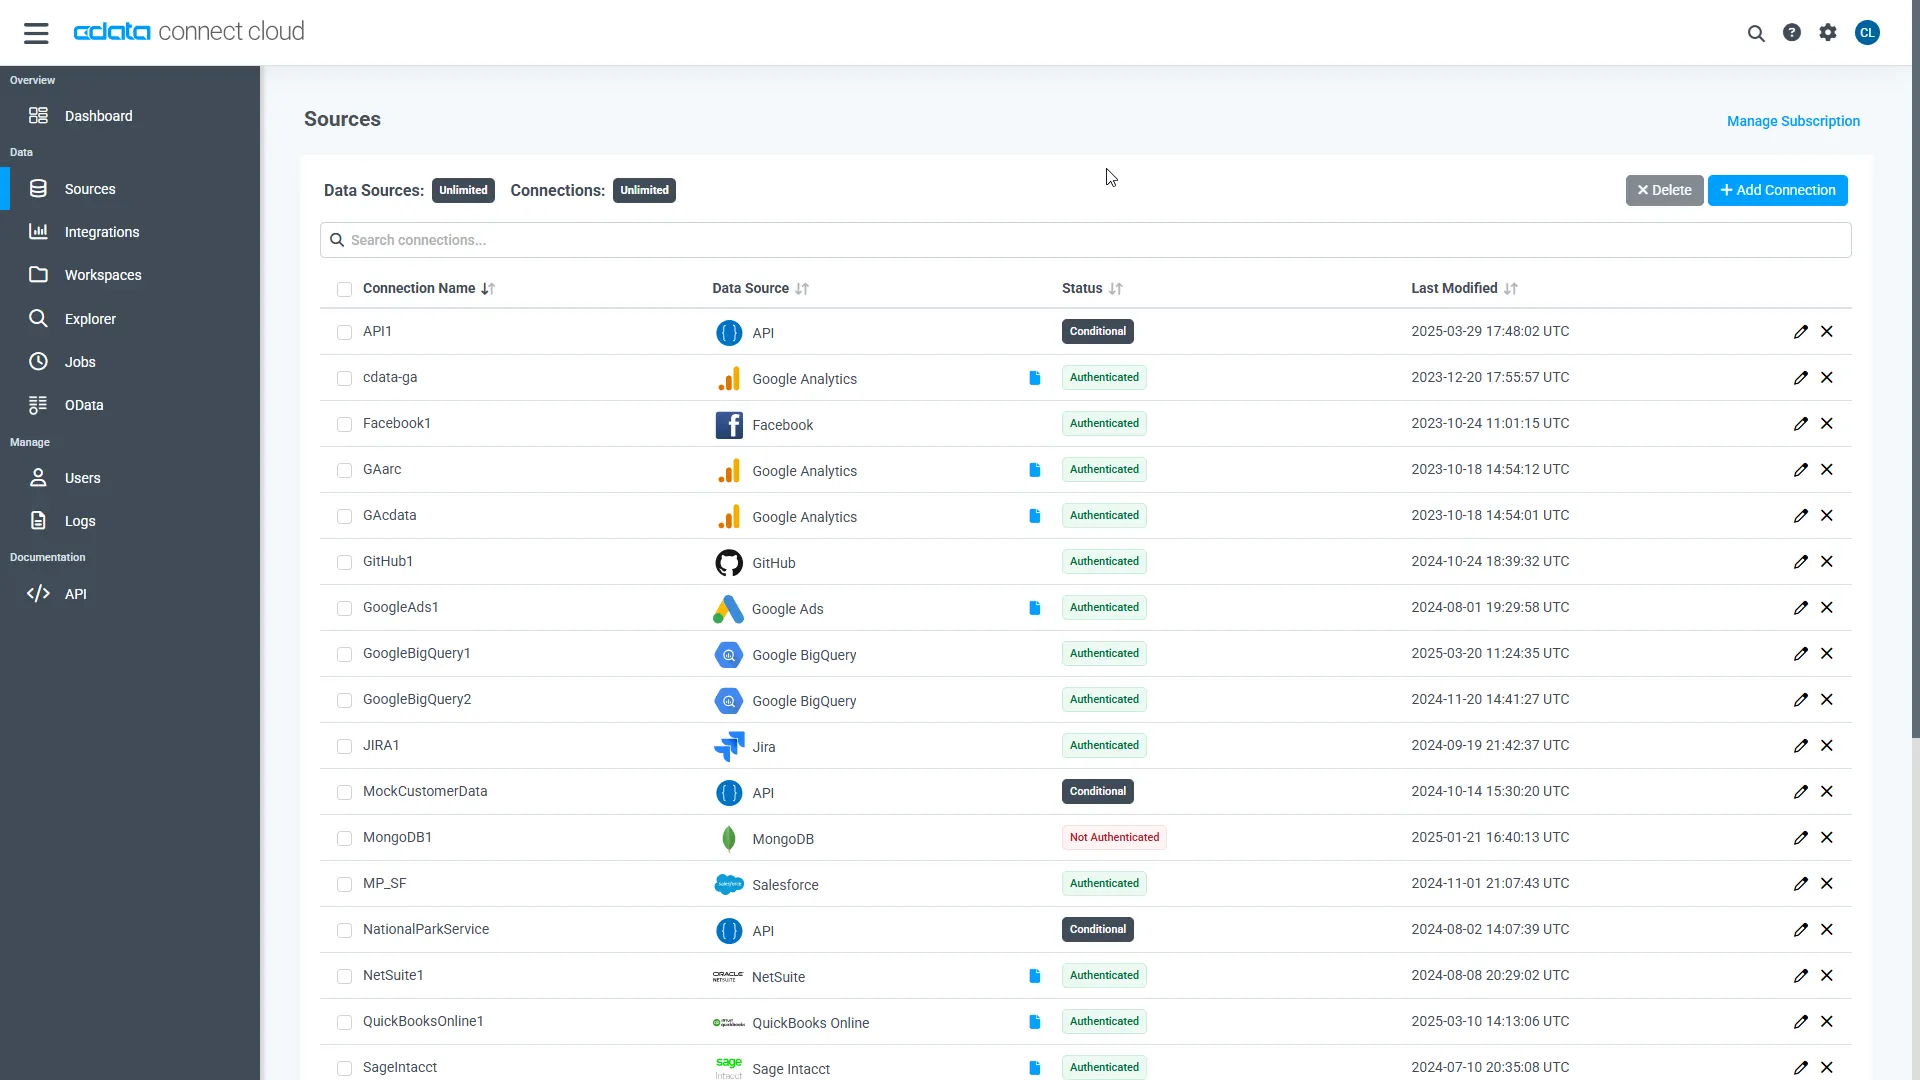
- Log into Connect AI, click Sources, and then click Add Connection
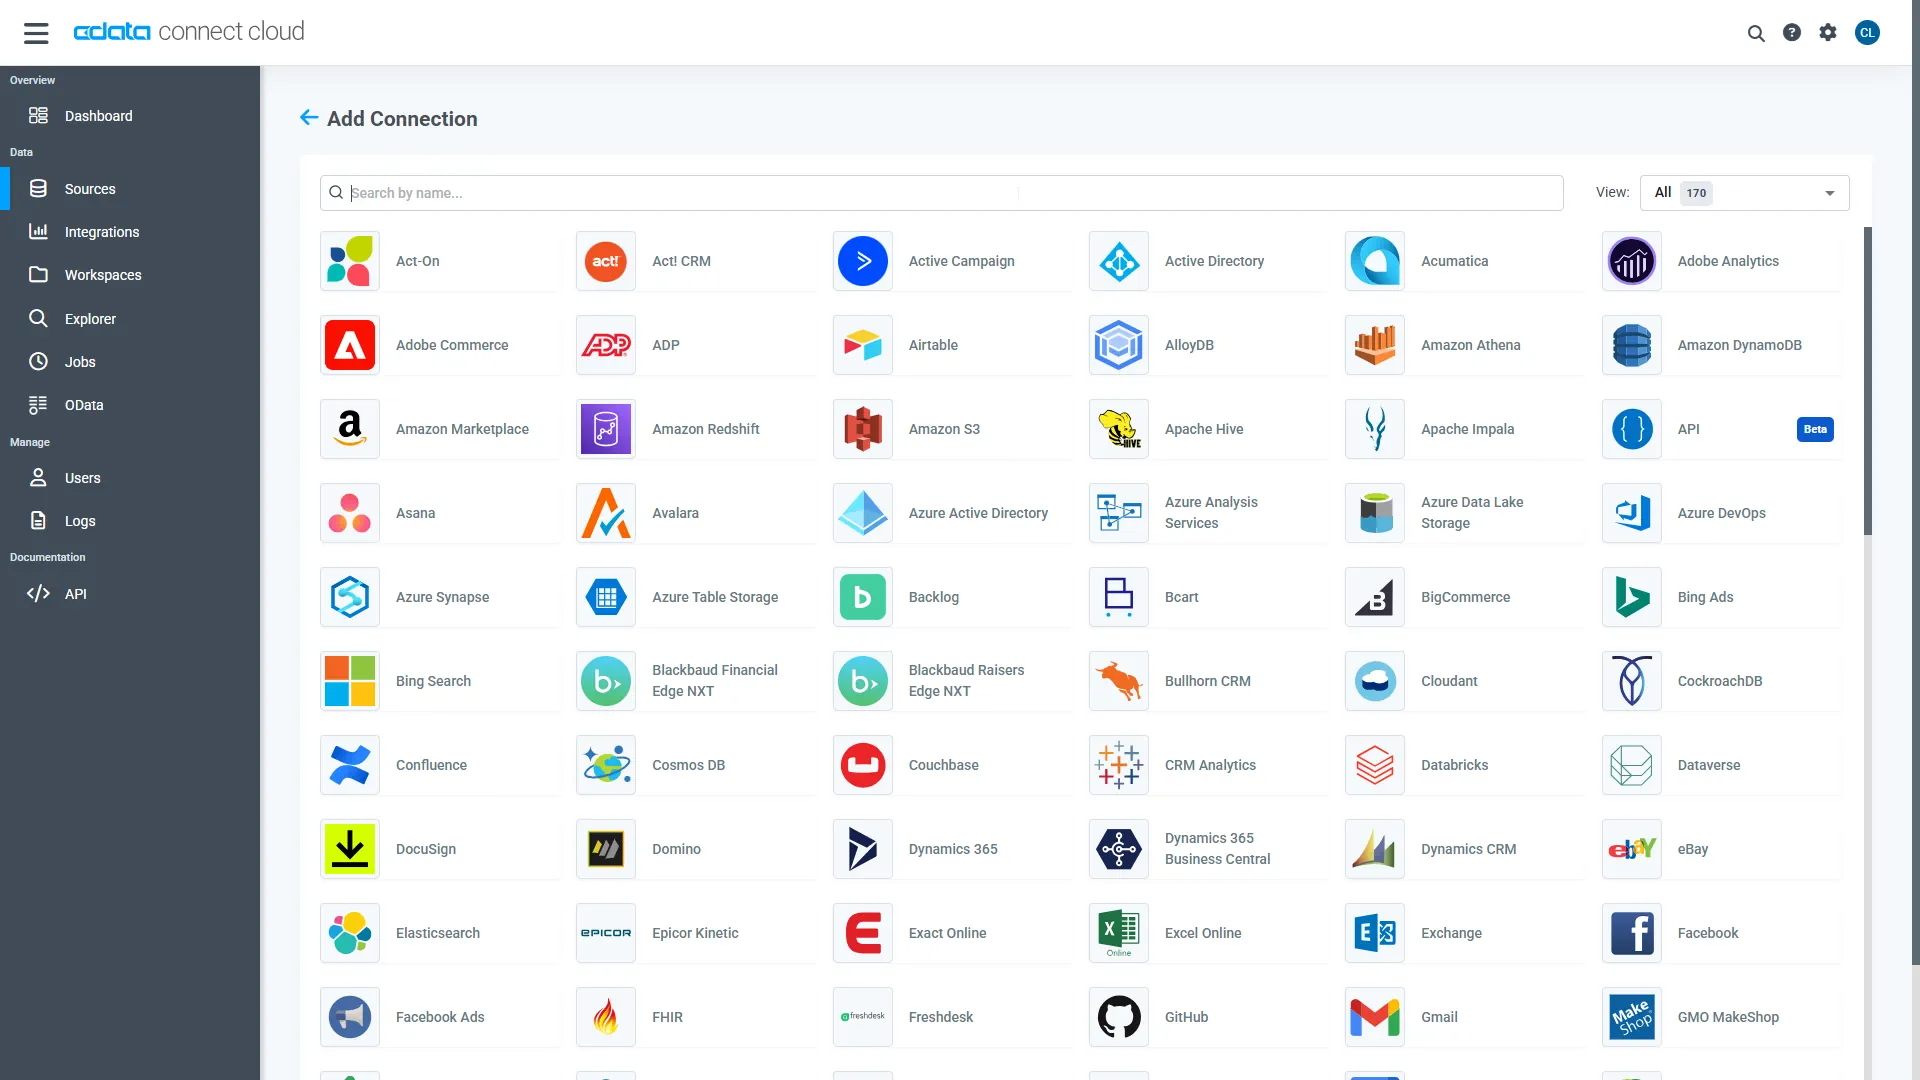
- Select "JD Edwards" from the Add Connection panel
-
Enter the necessary authentication properties to connect to JD Edwards.
The driver connects to JD Edwards through your Application Interface Services (AIS) Server. Set the following connection properties:
- URL: The base HTTPS URL of your AIS Server (e.g., https://jde-ais.example.com:8300).
- User: Your JD Edwards username.
- Password: Your JD Edwards password.
- Environment (optional): The JD Edwards environment to use (e.g., PD920 for production or DV920 for development). If not specified, the AIS Server's default environment is used.
- Role (optional): The JD Edwards role for the session. If not specified, the AIS Server's default role is used.
- DeviceName (optional): An identifier for the connecting device or application, used for auditing and logging on the AIS Server.
- Jasserver (optional): The specific Java Application Server (JAS) instance to route requests through, useful in clustered environments.
Choosing Which Data Is Exposed
JD Edwards organizes tables and business views by System Code, and the driver exposes each System Code as its own schema. Use these properties to control which schemas are available:
- DataModel: One or more ERP modules (comma-separated) whose System Codes are exposed as schemas, or All to expose every System Code in the connected instance. Defaults to FinancialManagement.
- SystemCodes: A comma-separated list of additional System Codes to expose alongside those from DataModel (e.g., 42,43).
When you connect, the driver sends your credentials to the AIS Server to obtain a session token and caches it. The driver requests a new token automatically before the session expires.
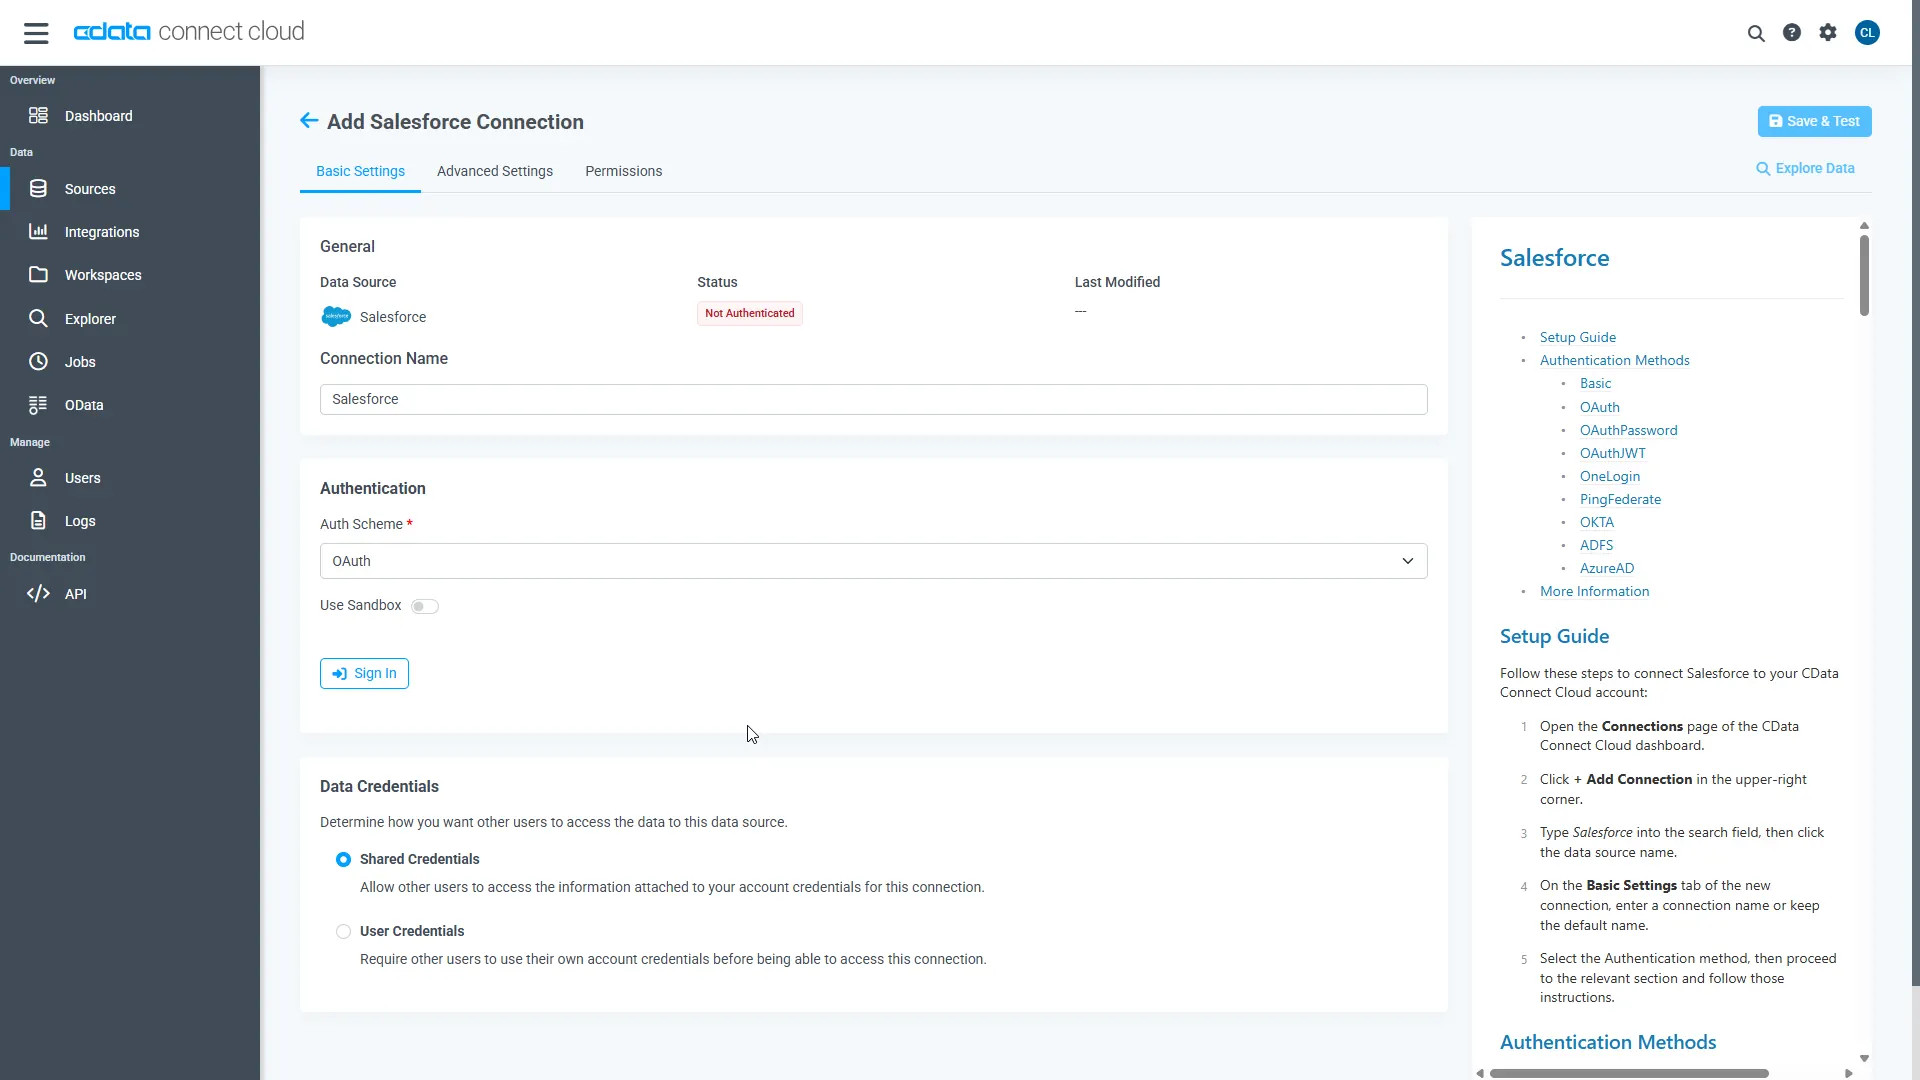
- Click Save & Test
-
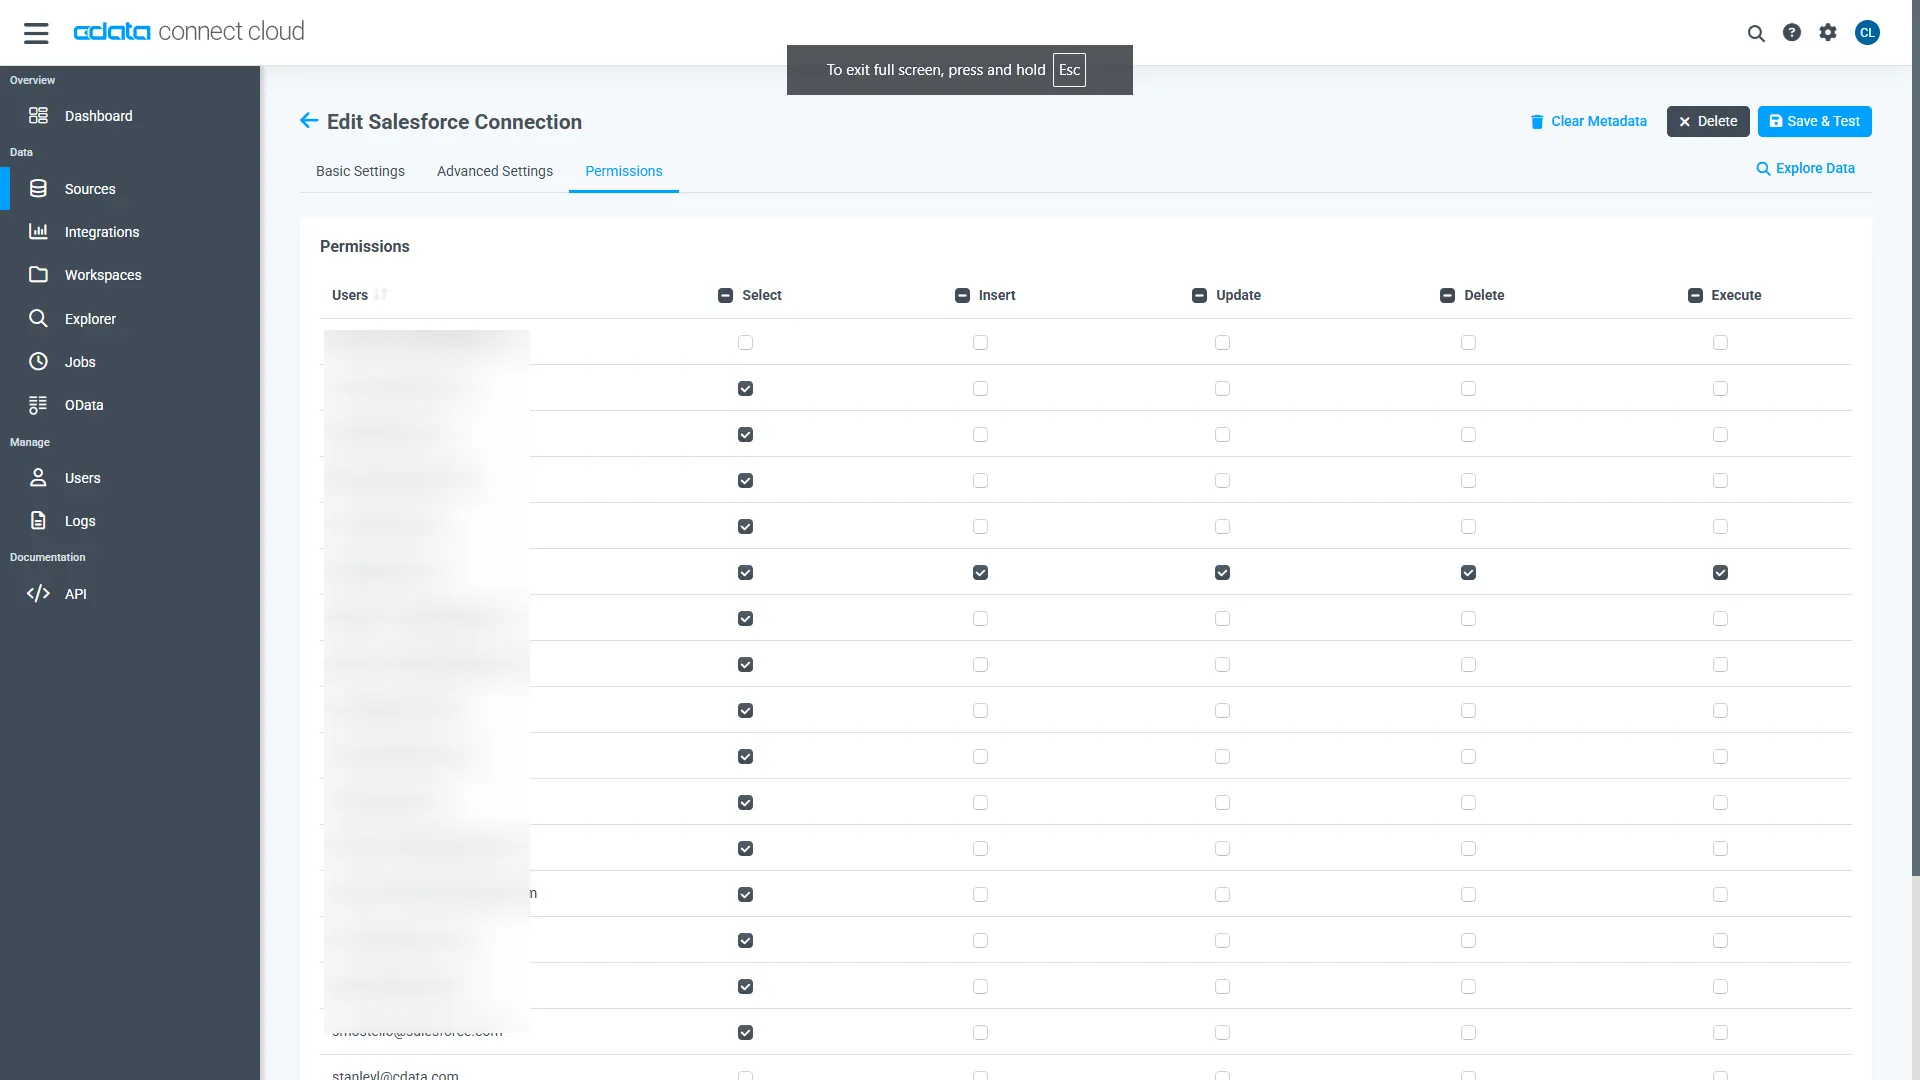
Navigate to the Permissions tab in the Add JD Edwards Connection page and update the User-based permissions.
Add a Personal Access Token
When connecting to Connect AI through the REST API, the OData API, or the Virtual SQL Server, a Personal Access Token (PAT) is used to authenticate the connection to Connect AI. It is best practice to create a separate PAT for each service to maintain granularity of access.
- Click on the Gear icon () at the top right of the Connect AI app to open the settings page.
- On the Settings page, go to the Access Tokens section and click Create PAT.
-
Give the PAT a name and click Create.
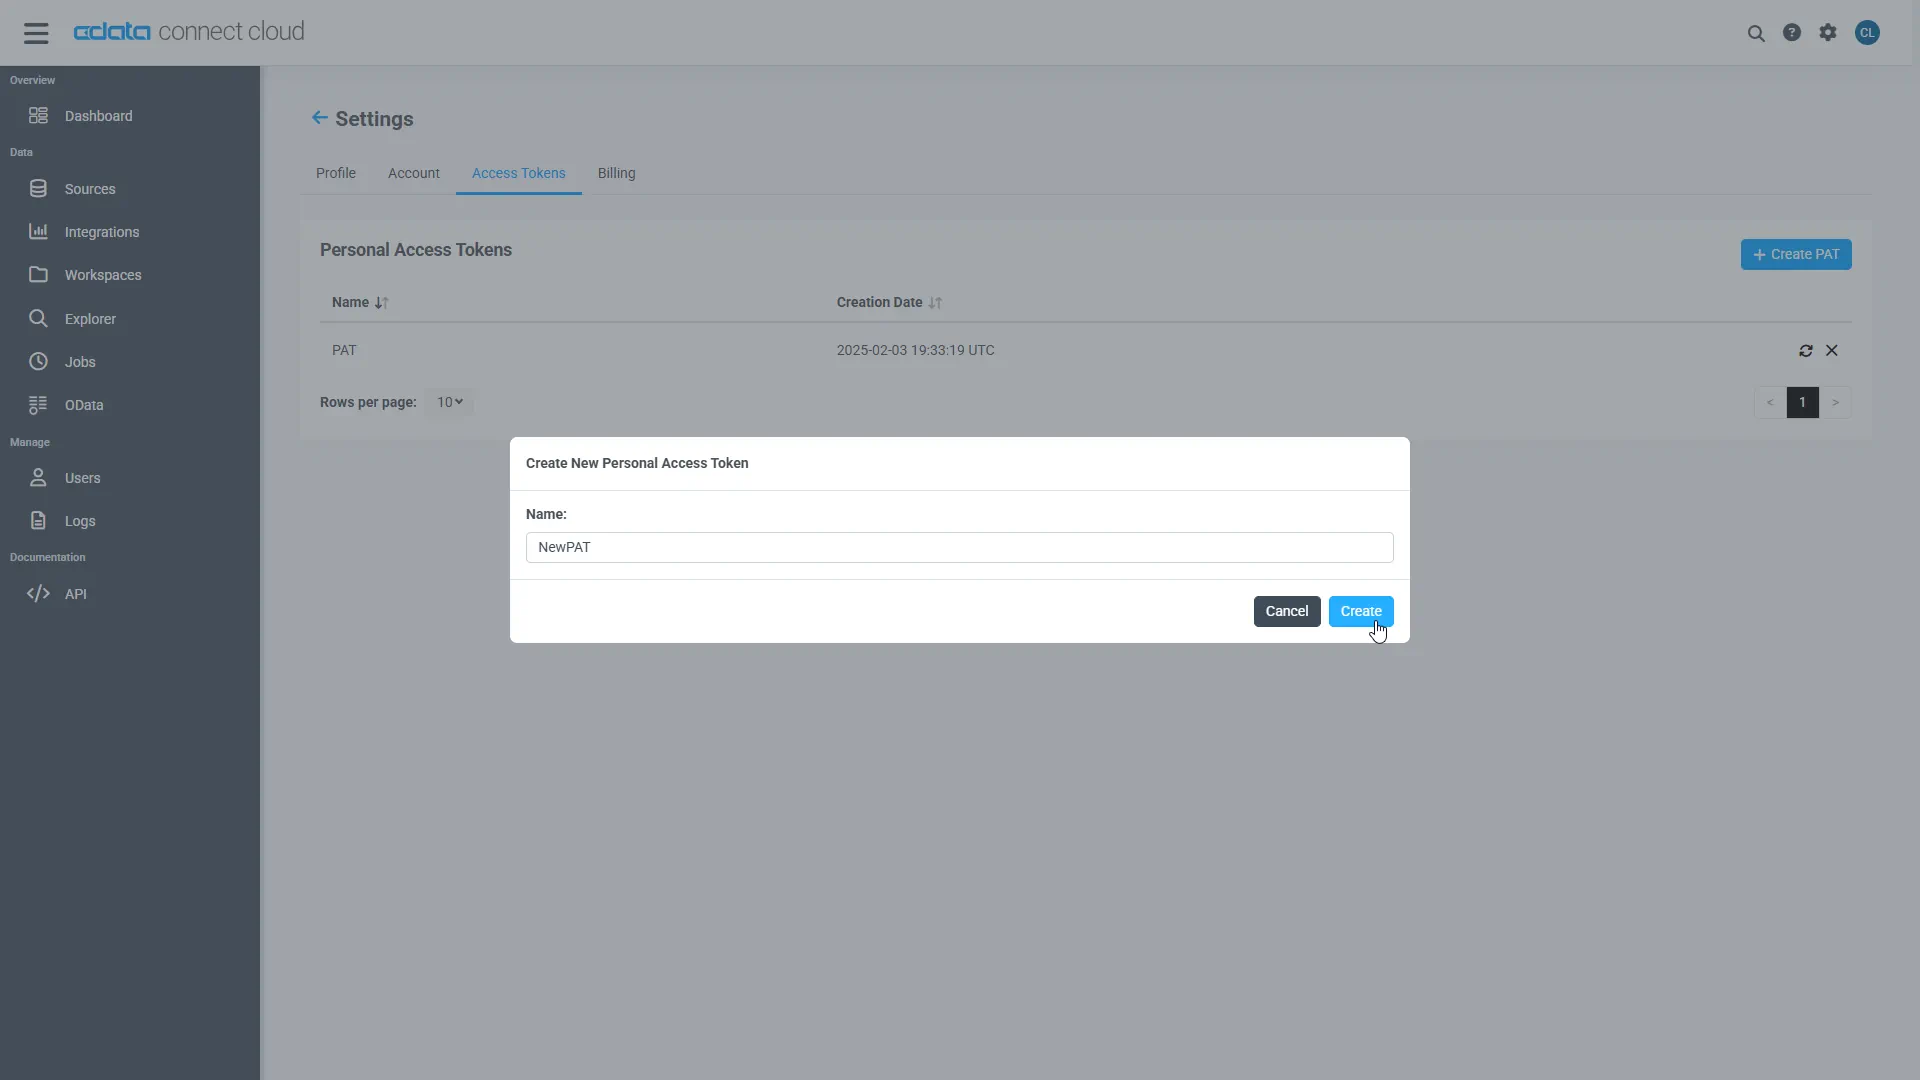
- The personal access token is only visible at creation, so be sure to copy it and store it securely for future use.
With the connection configured and a PAT generated, you are ready to connect to JD Edwards data from Looker.
Connect to JD Edwards in Looker
The steps below outline connecting to CData Connect AI from Looker to create a new JD Edwards data source.
- Log-in to Looker
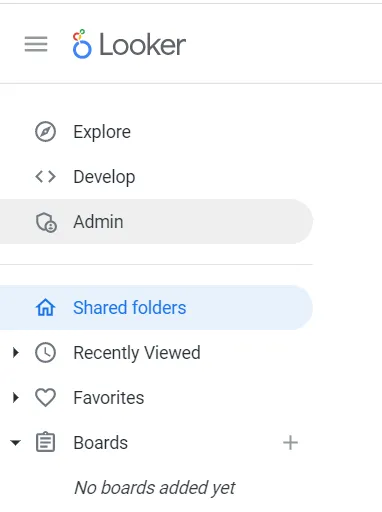
- In the navigation pane, select Admin.
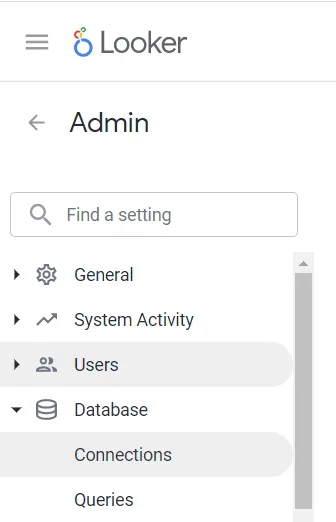
- Under the Database category, select Connections.
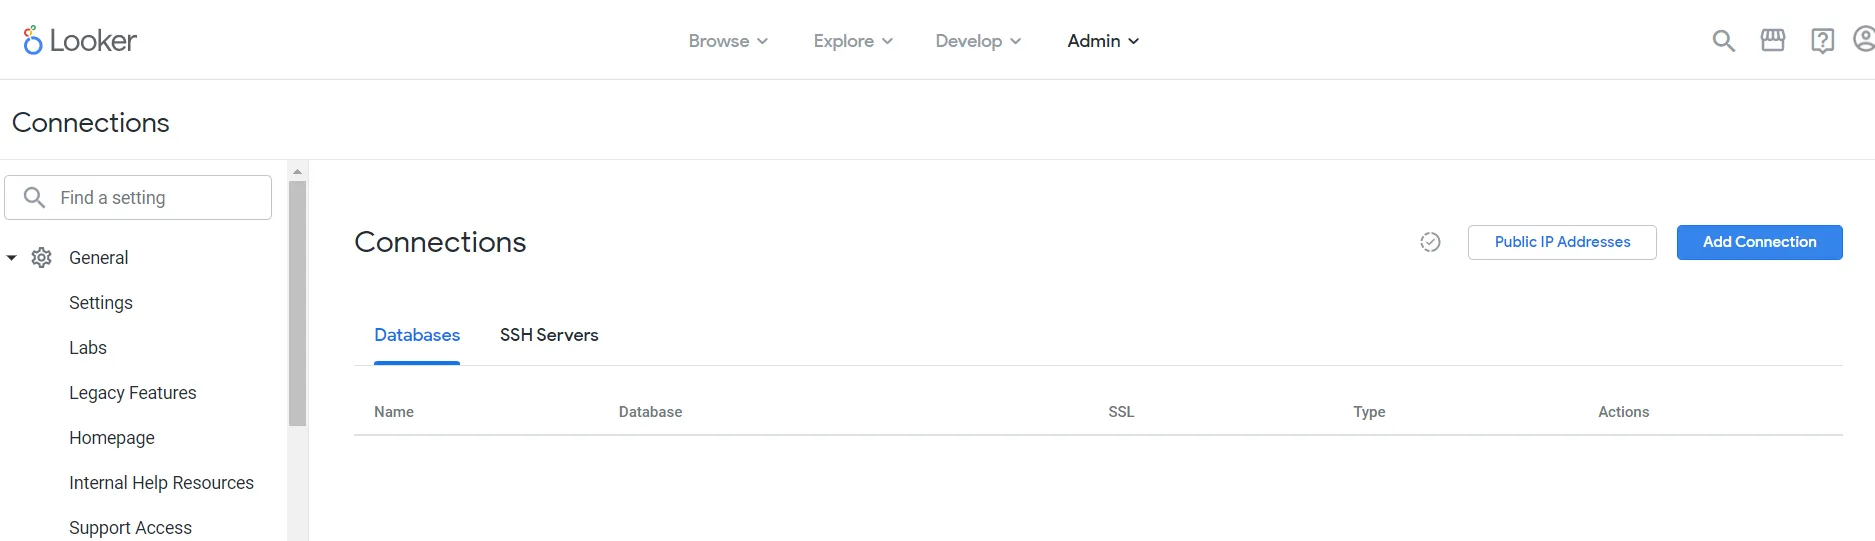
- On the Connections page, click Add Connection.
- Enter the connection settings:
- Name: the name for the connection in models.
- Dialect: select Microsoft SQL Server 2017+.
- SSH Server: leave this disabled.
- Remote Host:Port: enter tds.cdata.com in the first field and 14333 in the second field.
- Database: enter the Connection Name of the CData Connect AI data source you want to connect to (for example, QuickBooksOnline1).
- Username: enter your CData Connect AI username. This is displayed in the top-right corner of the CData Connect AI interface. For example, [email protected]
- Password: enter the PAT you generated on the Settings page
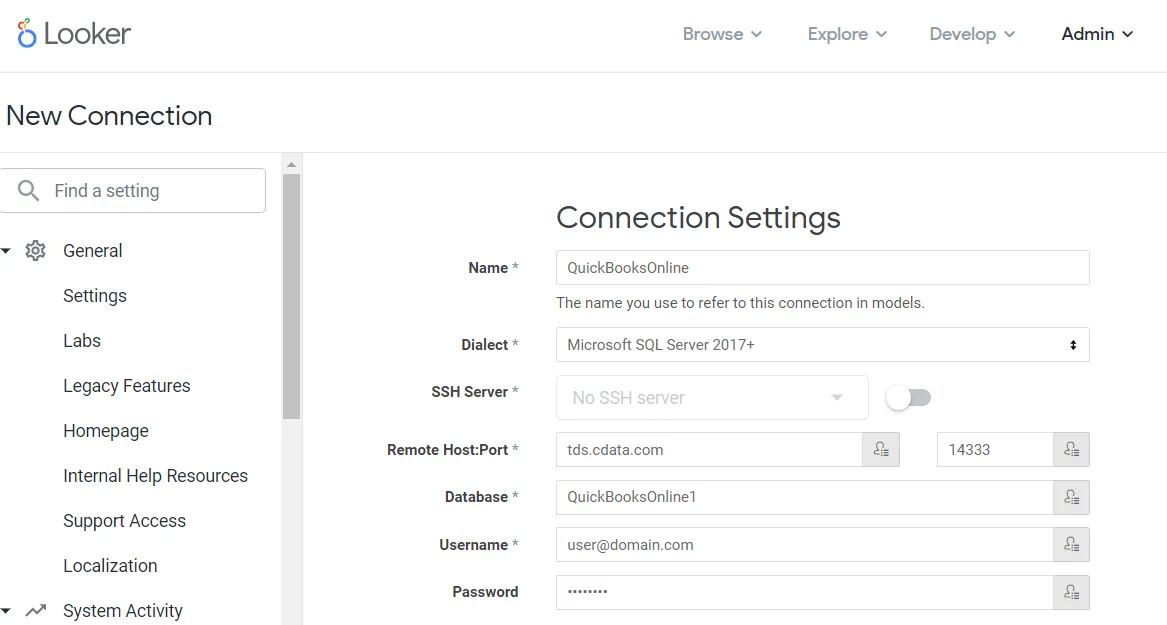
- At the bottom of the page, click Test These Settings to ensure that you can connect to CData Connect AI.
- Click Add Connection to create the connection and return to the
Connections page.
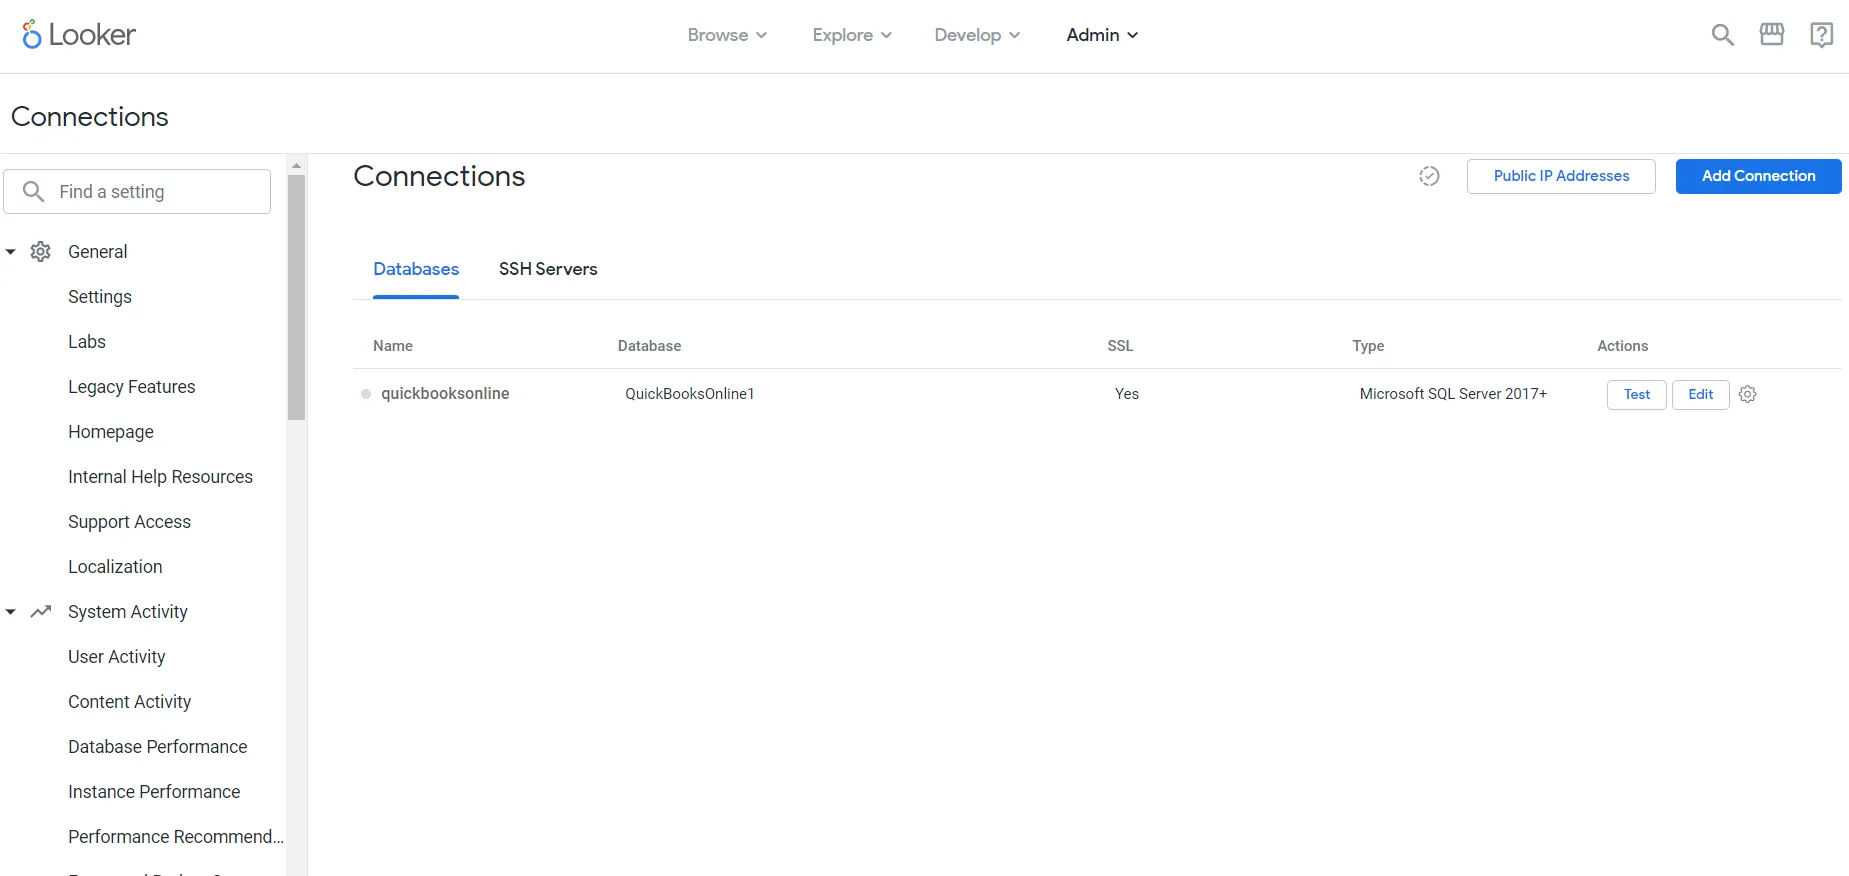
Your connection is now available for use in Looker. To connect to additional data sources from your CData Connect AI account, repeat the setup steps above, changing the value for Database for each data source.
Creating A Looker Visualization From The SQL Runner and Explore Features
To create a visualization in Looker using the SQL Runner, follow these steps:
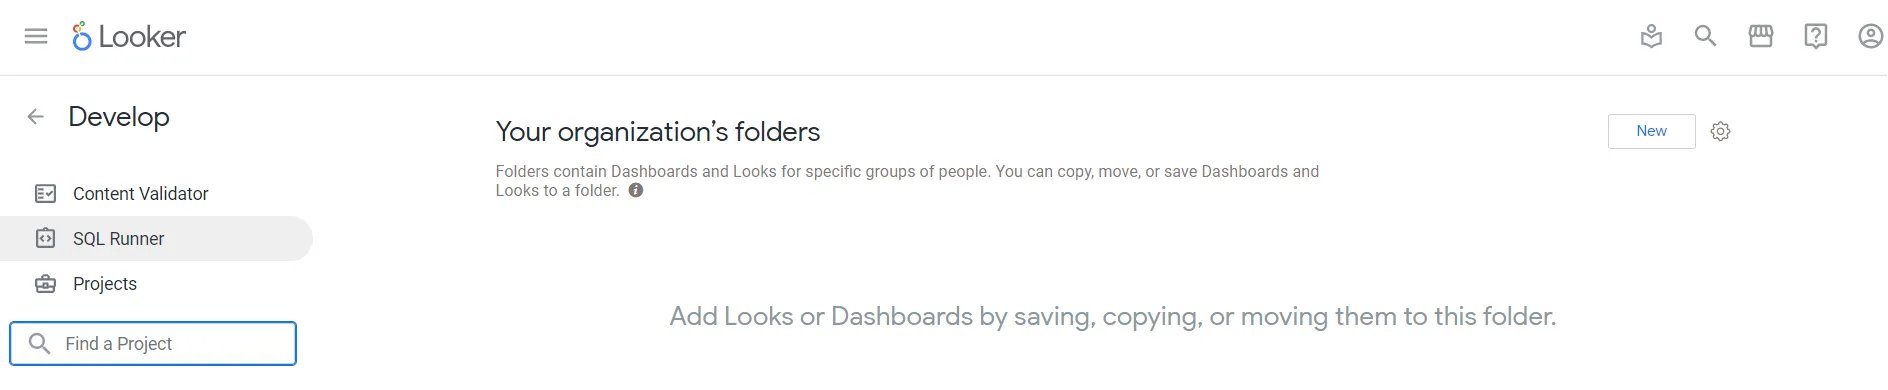
- In the Looker interface, select Develop -> SQL Runner from the left navigation pane.
- On the SQL Runner interface, select the connection you made in the previous steps.
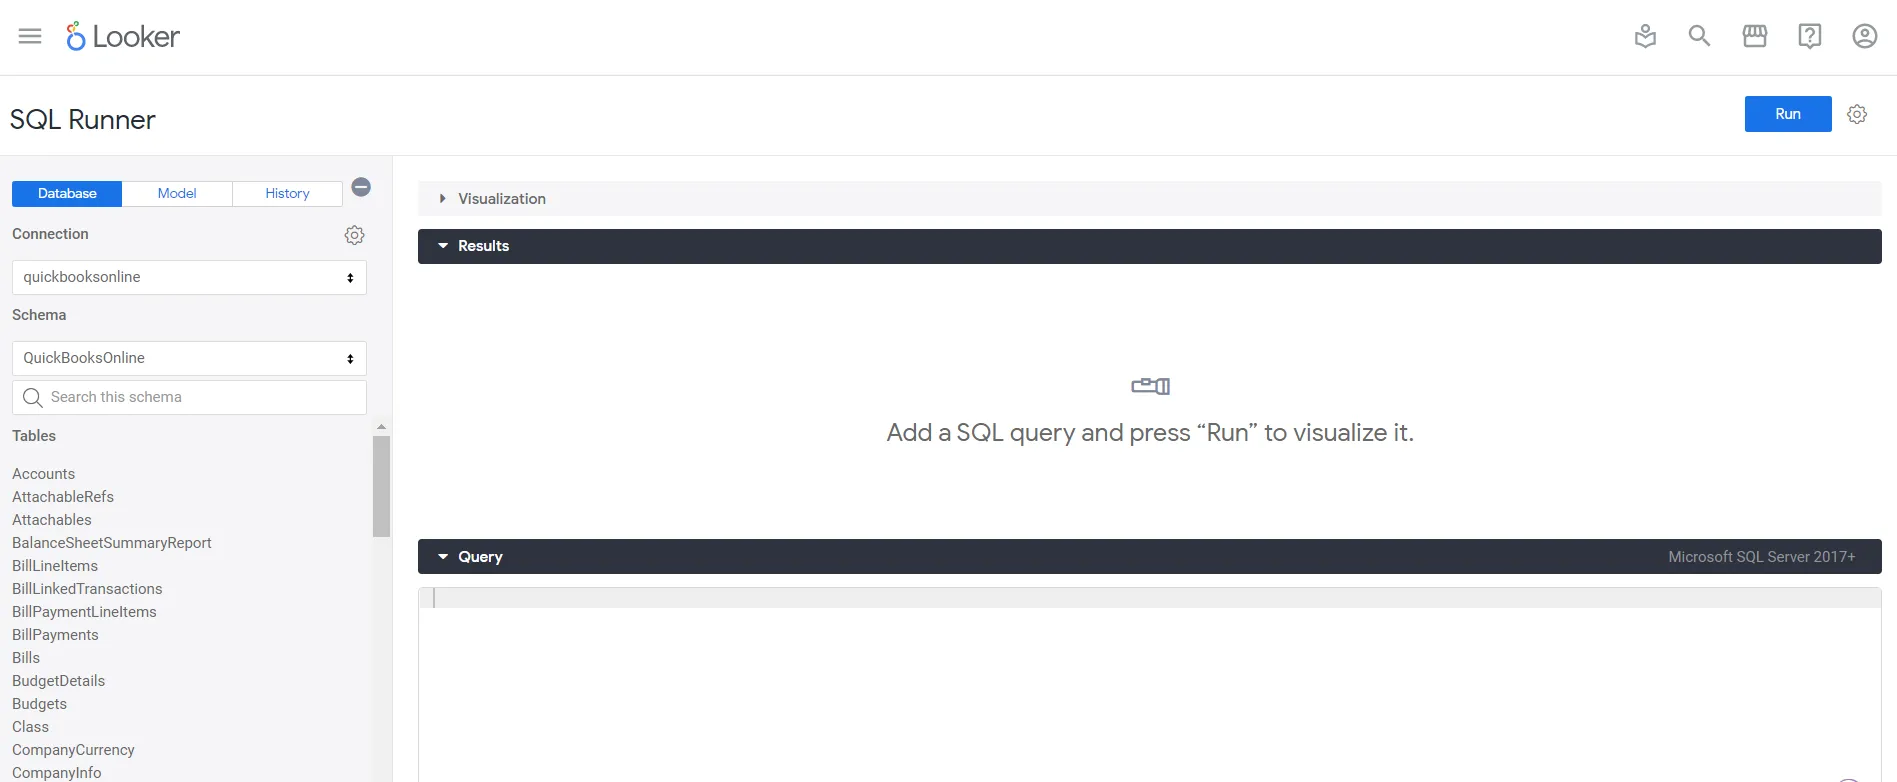
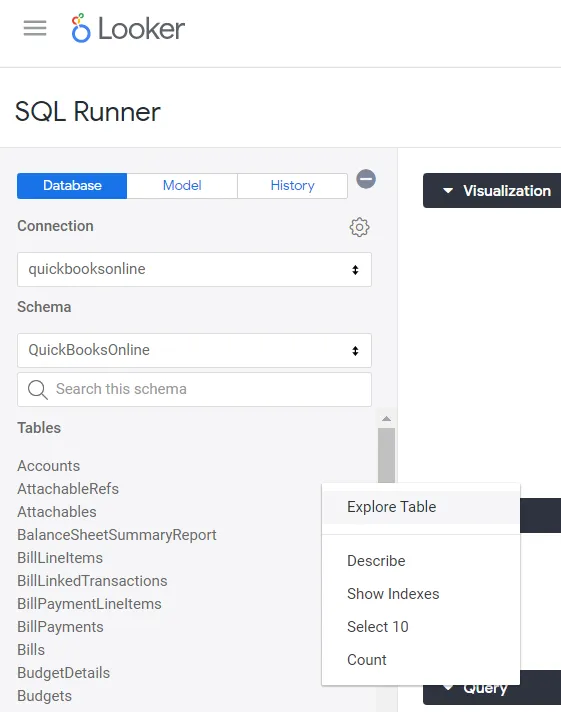
- Now, click the gear symbol next to a table and then select Explore Table.
- Next, on the left menu, select fields from the table and click Run. You can now expand the Visualization accordion, and see a bar chart, by default.
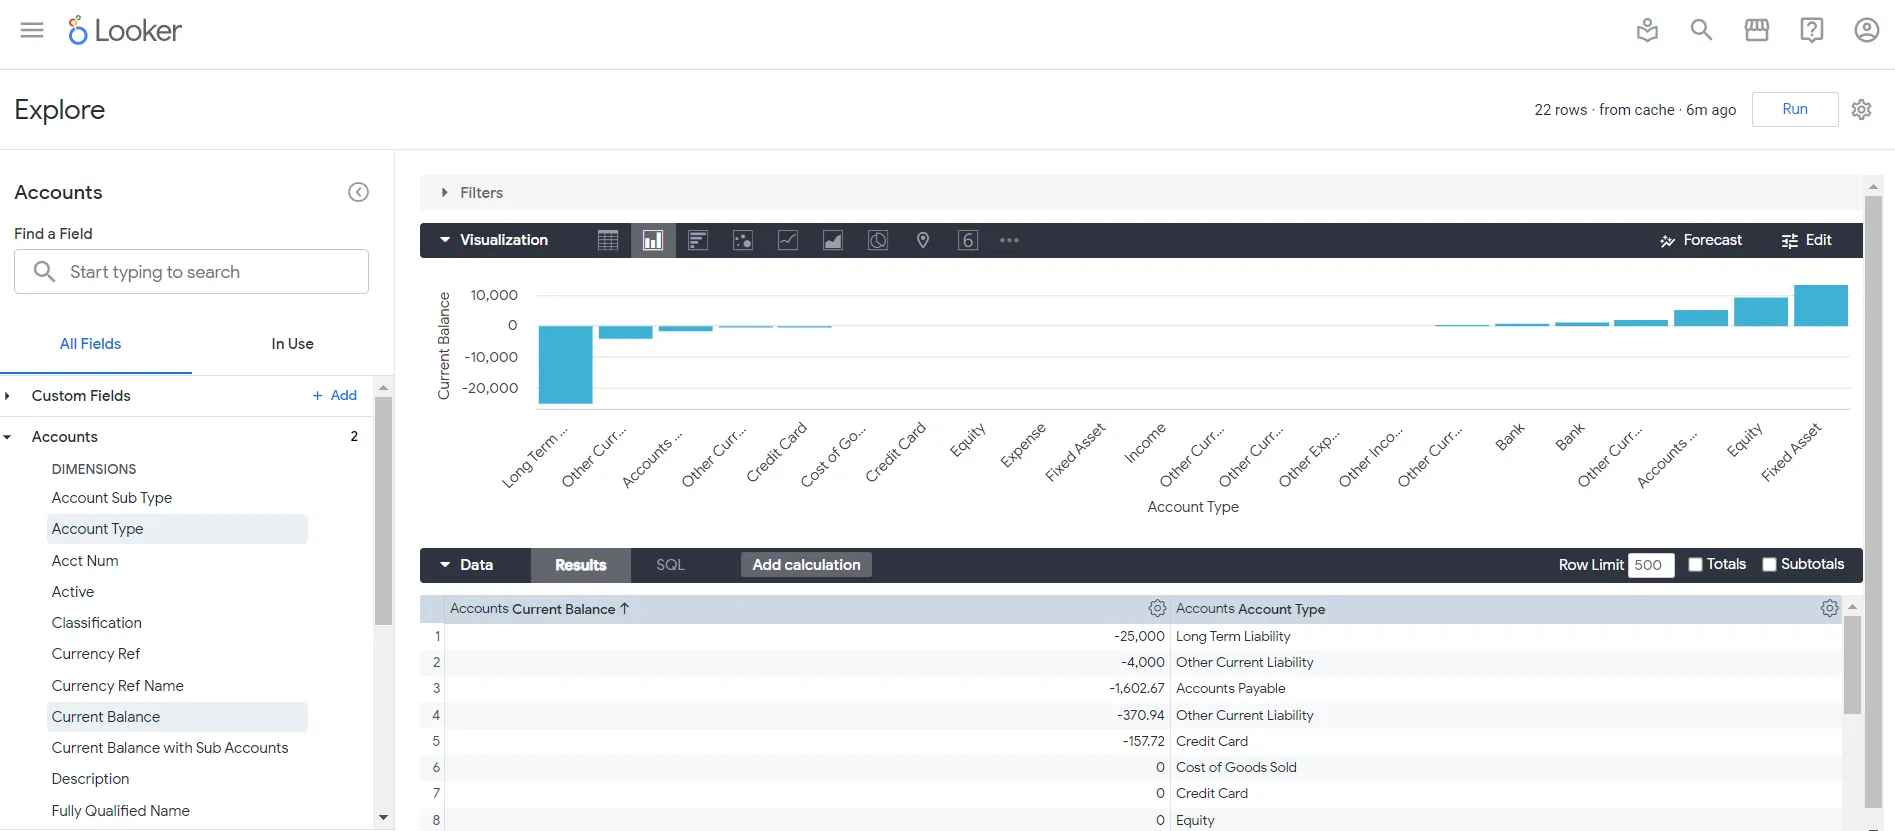
We have now created a visualization of JD Edwards data in Looker using CData Connect AI!
Get CData Connect AI
To get live data access to hundreds of SaaS, Big Data, and NoSQL sources directly from your cloud applications, try CData Connect AI today!