




Publish Reports with JD Edwards Data in SAP Crystal Reports

Crystal Reports has many options for offloading data processing to remote data; this enables real-time reporting. With the support for JDBC in Crystal Reports, the CData JDBC Driver for JD Edwards brings this capability to Crystal Reports. This article shows how to create a report on JD Edwards data that refreshes when you run the report.
Refer to the given table for the tools and their versions used in this article:
| Application Name | Version |
|---|---|
| SAP Crystal Reports 2020 | SP3 |
| JDBC Driver | 23.0.8565 |
Deploy the JDBC Driver
Install the CData JDBC Driver for JD Edwards by including the driver JAR in the Crystal Reports classpath: Add the full file path, including the .jar, to the paths in the ClassPath element under the DataDriverCommonElement.
The default location for the CRConfig.xml file is C:\Program Files (x86)\SAP BusinessObjects\SAP BusinessObjects Enterprise XI 4.0\java — the path might be slightly different based on your installation. The driver JAR is located in the lib subfolder of the installation directory.
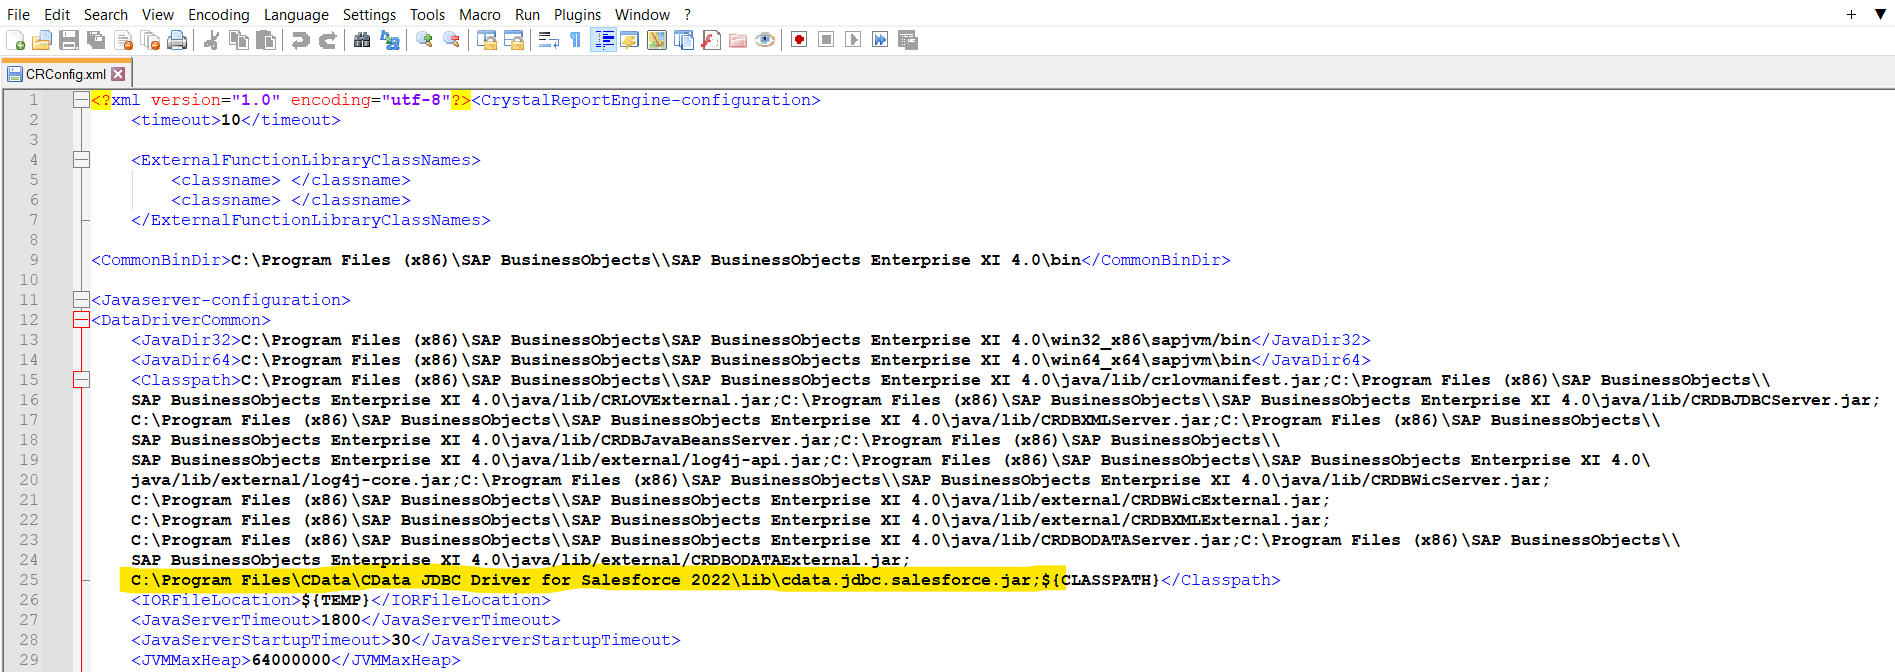
After you have added the JAR to the ClassPath, restart Crystal Reports.
Connect to JD Edwards Data
After deploying the JDBC driver for JD Edwards, you can use the Report Wizard to add JD Edwards data to a new report.
- Click File -> New -> Standard Report.
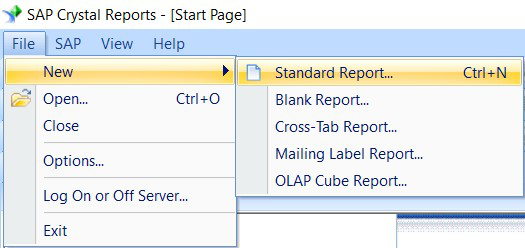
- Expand the JDBC (JNDI) under Create New Connection and double-click Make a New Connection.
- Create a connection string using CData JDBC Driver for JD Edwards.
- URL: The base HTTPS URL of your AIS Server (e.g., https://jde-ais.example.com:8300).
- User: Your JD Edwards username.
- Password: Your JD Edwards password.
- Environment (optional): The JD Edwards environment to use (e.g., PD920 for production or DV920 for development). If not specified, the AIS Server's default environment is used.
- Role (optional): The JD Edwards role for the session. If not specified, the AIS Server's default role is used.
- DeviceName (optional): An identifier for the connecting device or application, used for auditing and logging on the AIS Server.
- Jasserver (optional): The specific Java Application Server (JAS) instance to route requests through, useful in clustered environments.
- DataModel: One or more ERP modules (comma-separated) whose System Codes are exposed as schemas, or All to expose every System Code in the connected instance. Defaults to FinancialManagement.
- SystemCodes: A comma-separated list of additional System Codes to expose alongside those from DataModel (e.g., 42,43).
In the wizard, enter the JDBC connection URL:
jdbc:jdedwards:URL=https://your-jde-environment-app.example.com;User=admin;Password=myPassword;Set the driver class name:
cdata.jdbc.jdedwards.JDEdwardsDriver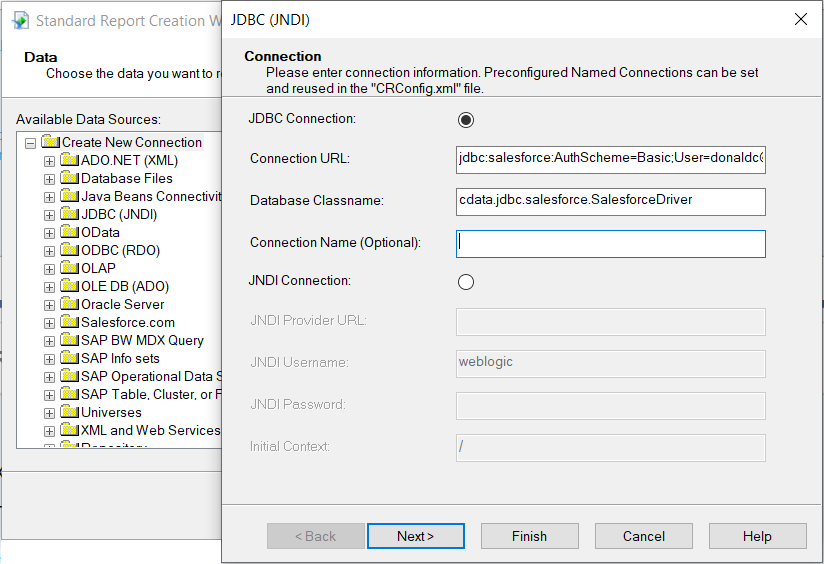
- Select the tables needed in the report.
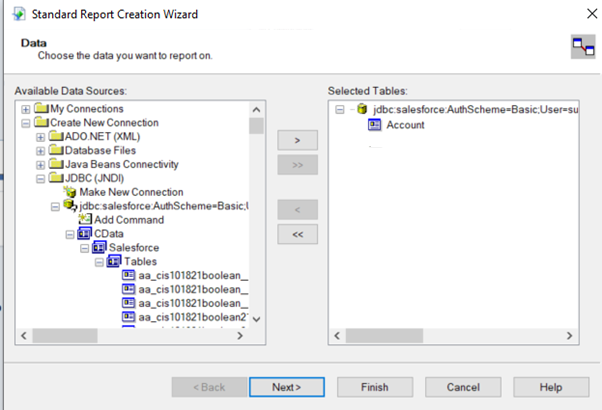
- You can also link tables from the JD Edwards data in SAP Crystal Reports. Click on NEXT after adding the links between tables.
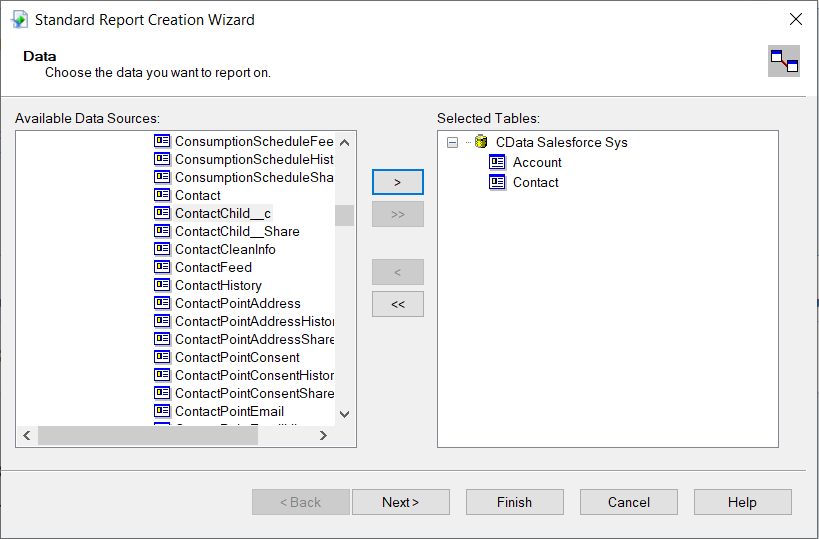
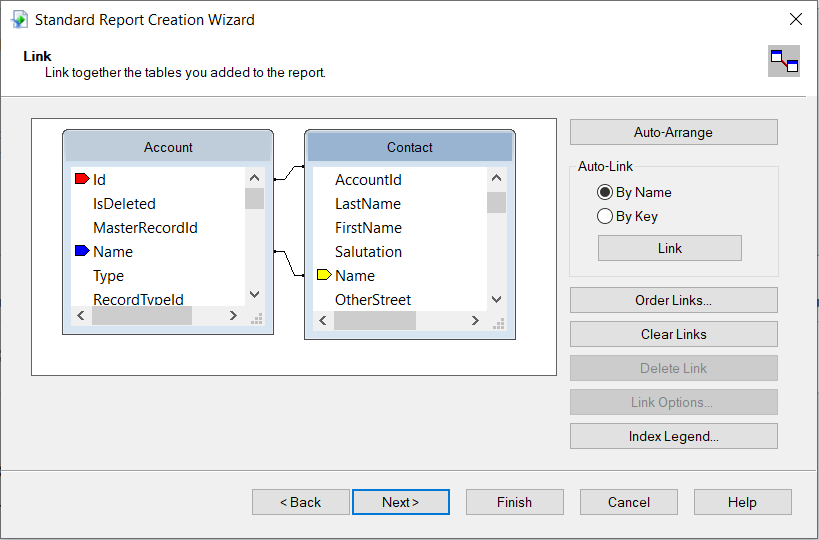
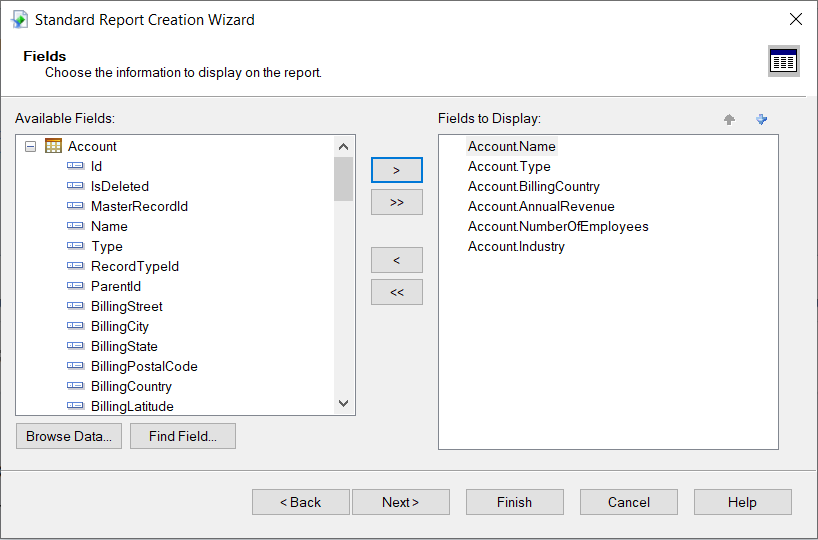
- After the tables are selected, select the fields you want displayed in the report from the selected table, followed by NEXT.
- Select the "Group By" field to group the information on the report.
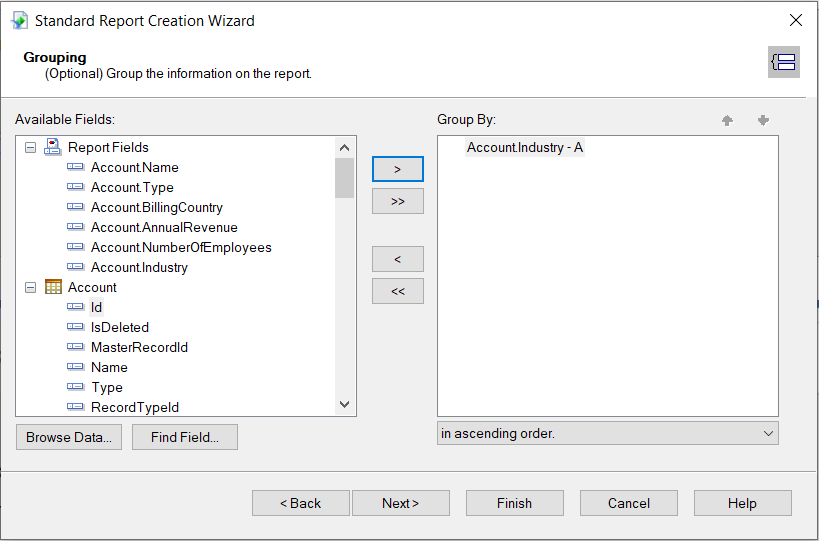
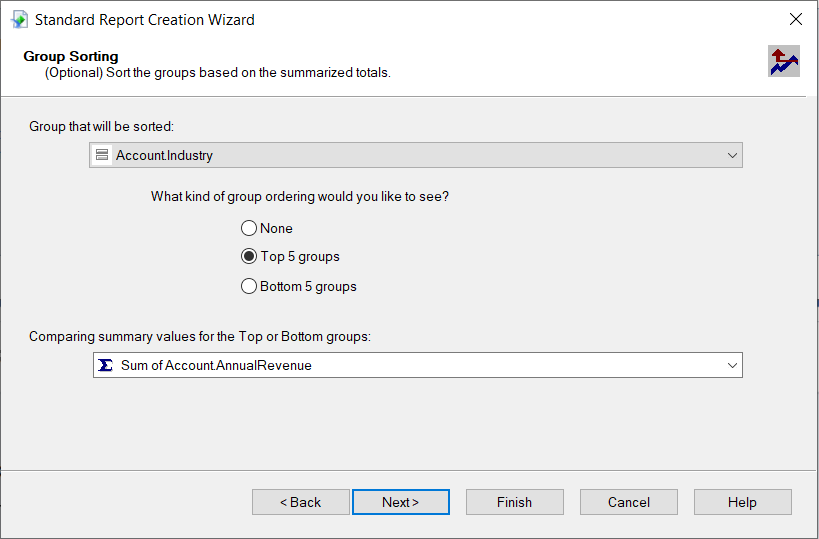
- Sort the groups based on summarised totals and click on NEXT.
For assistance constructing the JDBC URL, use the connection string designer built into the JD Edwards JDBC Driver. Double-click the JAR file or execute the jar file from the command line.
java -jar cdata.jdbc.jdedwards.jar
The driver connects to JD Edwards through your Application Interface Services (AIS) Server. Set the following connection properties:
Choosing Which Data Is Exposed
JD Edwards organizes tables and business views by System Code, and the driver exposes each System Code as its own schema. Use these properties to control which schemas are available:
When you connect, the driver sends your credentials to the AIS Server to obtain a session token and caches it. The driver requests a new token automatically before the session expires.
Fill in the connection properties and copy the connection string to the clipboard.
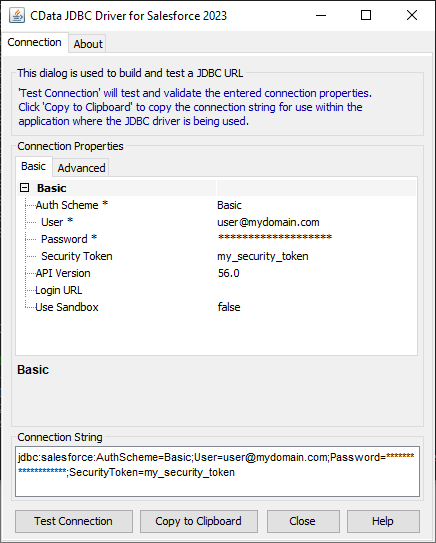
When configuring the JDBC URL, you may also want to set the Max Rows connection property. This will limit the number of rows returned, which is especially helpful for improving performance when designing reports and visualizations.
You can then configure grouping, sorting, and summaries. See the following section to use the aggregate and summary to create a chart.
Create a Chart
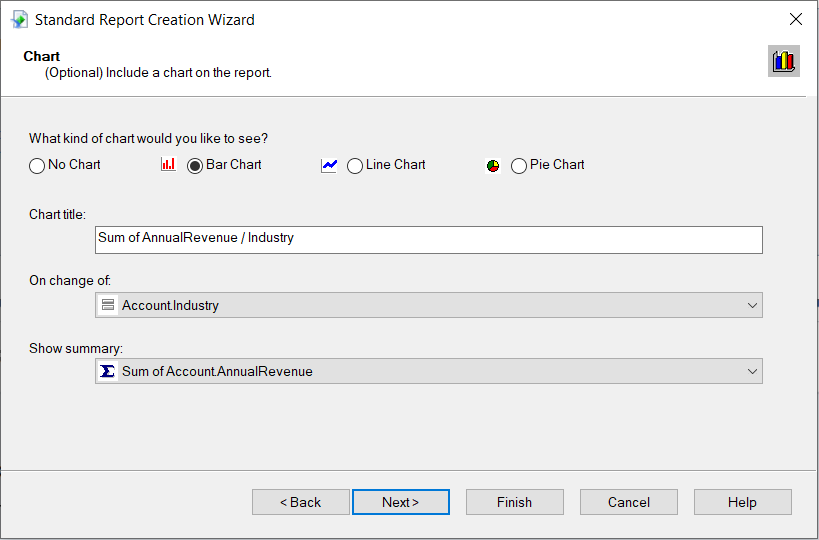
After selecting a column to group by, the Standard Report Creation Wizard presents the option to create a chart. Follow the steps below to create a chart aggregating the DocumentNumber column's values.
- In the Standard Report Creation Wizard, select the Bar Chart option and select the column you grouped by in the "On change of" menu.
- In the Show Summary menu, select the summary you created.
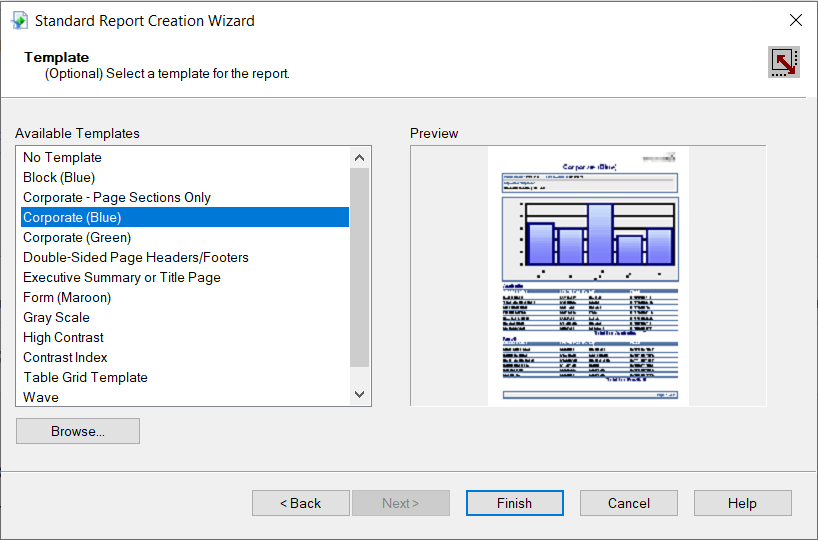
- Select filters and a template, as needed, to finish the wizard.
Select a template for the report to preview the finished report and view the chart populated with your data.
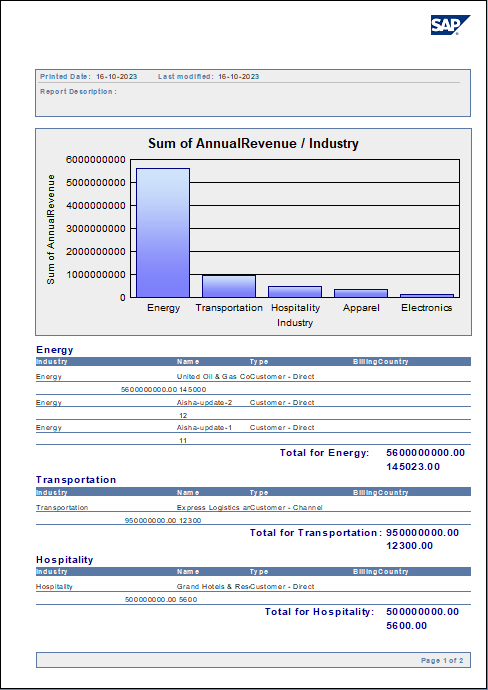
The Final Report
You can now see that the report contains all the fields initially specified.
Working with Remote Data
To ensure that you see updates to the data, click File and clear the "Save Data with Report" option. As you interact with the report, for example, drilling down to hidden details, Crystal Reports executes SQL queries to retrieve the data needed to display the report. To reload data you have already retrieved, refresh or rerun the report.
You can offload processing onto the driver by hiding details elements and enabling server-side grouping. To do this, you need to select a column to group by in the report creation wizard.
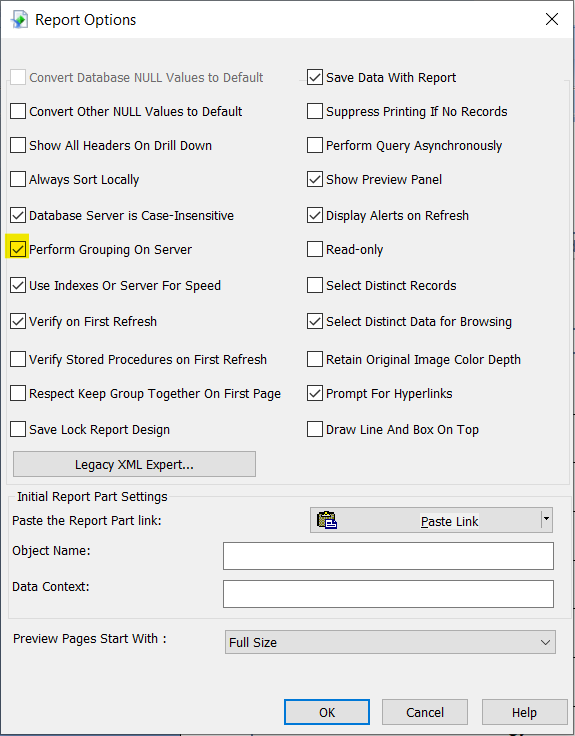
- Click File -> Report Options and select the "Perform Grouping On Server" option.
- Click Report -> Section Expert and select the Details section of your report. Select the "Hide (Drill-Down OK)" option.
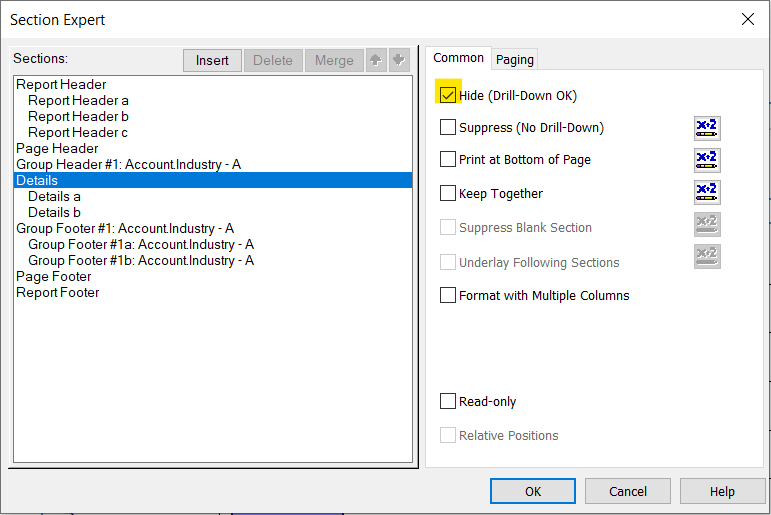
When you preview your report with the hidden details, Crystal Reports executes a GROUP BY query. When you double-click a column in the chart to drill down to details, Crystal Reports executes a SELECT WHERE query that decreases load times by retrieving only the data needed.
At this point, you have created a SAP Crystal report built on top of live JD Edwards data using SAP Crystal Reports and a CData JDBC Driver. Learn more about the CData JDBC Driver for JD Edwards and download a free trial from the JD Edwards JDBC Driver page. Let our Support Team know if you have any questions.
Ready to get started?
Download a free trial of the JD Edwards Driver to get started:
Download NowLearn more:
 JD Edwards JDBC Driver
Rapidly create and deploy powerful Java applications that integrate with JD Edwards data including AccountLedger, ProposalofPayment, ContractRevenueSummary, EmployeeEnrollment, RentIncreaseAmounts, and more!