




Explore Geographical Relationships in JD Edwards Data with Power Map

The CData ODBC Driver for JD Edwards is easy to set up and use with self-service analytics solutions like Power BI: Microsoft Excel provides built-in support for the ODBC standard. This article shows how to load the current JD Edwards data into Excel and start generating location-based insights on JD Edwards data in Power Map.
Create an ODBC Data Source for JD Edwards
If you have not already, first specify connection properties in an ODBC DSN (data source name). This is the last step of the driver installation. You can use the Microsoft ODBC Data Source Administrator to create and configure ODBC DSNs.
The driver connects to JD Edwards through your Application Interface Services (AIS) Server. Set the following connection properties:
- URL: The base HTTPS URL of your AIS Server (e.g., https://jde-ais.example.com:8300).
- User: Your JD Edwards username.
- Password: Your JD Edwards password.
- Environment (optional): The JD Edwards environment to use (e.g., PD920 for production or DV920 for development). If not specified, the AIS Server's default environment is used.
- Role (optional): The JD Edwards role for the session. If not specified, the AIS Server's default role is used.
- DeviceName (optional): An identifier for the connecting device or application, used for auditing and logging on the AIS Server.
- Jasserver (optional): The specific Java Application Server (JAS) instance to route requests through, useful in clustered environments.
Choosing Which Data Is Exposed
JD Edwards organizes tables and business views by System Code, and the driver exposes each System Code as its own schema. Use these properties to control which schemas are available:
- DataModel: One or more ERP modules (comma-separated) whose System Codes are exposed as schemas, or All to expose every System Code in the connected instance. Defaults to FinancialManagement.
- SystemCodes: A comma-separated list of additional System Codes to expose alongside those from DataModel (e.g., 42,43).
When you connect, the driver sends your credentials to the AIS Server to obtain a session token and caches it. The driver requests a new token automatically before the session expires.
When you configure the DSN, you may also want to set the Max Rows connection property. This will limit the number of rows returned, which is especially helpful for improving performance when designing reports and visualizations.
When you configure the DSN, you may also want to set the Max Rows connection property. This will limit the number of rows returned, which is especially helpful for improving performance when designing reports and visualizations.
Import JD Edwards Data into Excel
You can import data into Power Map either from an Excel spreadsheet or from Power Pivot. For a step-by-step guide to use either method to import JD Edwards data, see the "Using the ODBC Driver" section in the help documentation.
Geocode JD Edwards Data
After importing the JD Edwards data into an Excel spreadsheet or into PowerPivot, you can drag and drop JD Edwards entities in Power Map. To open Power Map, click any cell in the spreadsheet and click Insert -> Map.
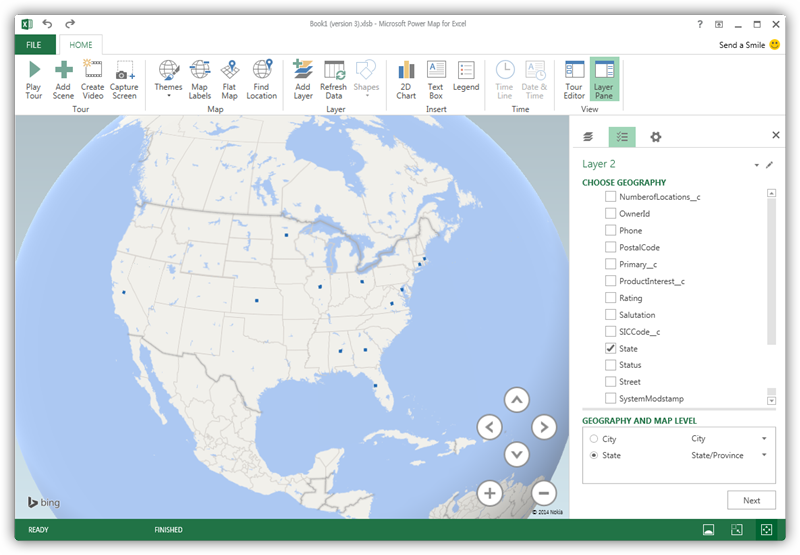
In the Choose Geography menu, Power Map detects the columns that have geographic information. In the Geography and Map Level menu in the Layer Pane, you can select the columns you want to work with. Power Map then plots the data. A dot represents a record that has this value. When you have selected the geographic columns you want, click Next.
Select Measures and Categories
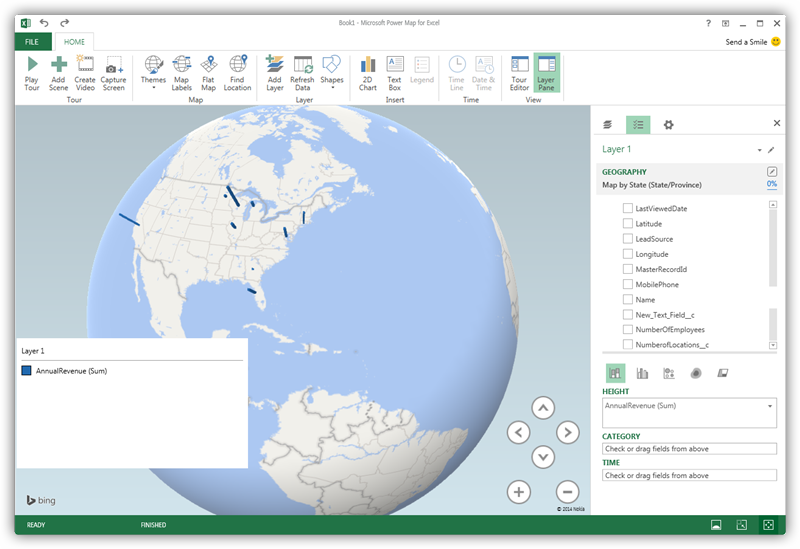
You can then simply select columns: Measures and categories are automatically detected. The available chart types are Stacked Column, Clustered Column, Bubble, Heat Map, and Region.
Ready to get started?
Download a free trial of the JD Edwards ODBC Driver to get started:
Download NowLearn more:
 JD Edwards ODBC Driver
The JD Edwards ODBC Driver is a powerful tool that allows you to connect with live data from JD Edwards, directly from any applications that support ODBC connectivity.
Access JD Edwards data like you would a database - read JD Edwards AccountLedger, ProposalofPayment, ContractRevenueSummary, EmployeeEnrollment, RentIncreaseAmounts, etc. through a standard ODBC Driver interface.