




How to Visualize JD Edwards Data in Python with pandas

The rich ecosystem of Python modules lets you get to work quickly and integrate your systems more effectively. With the CData Python Connector for JD Edwards, the pandas & Matplotlib modules, and the SQLAlchemy toolkit, you can build JD Edwards-connected Python applications and scripts for visualizing JD Edwards data. This article shows how to use the pandas, SQLAlchemy, and Matplotlib built-in functions to connect to JD Edwards data, execute queries, and visualize the results.
With built-in optimized data processing, the CData Python Connector offers unmatched performance for interacting with live JD Edwards data in Python. When you issue complex SQL queries from JD Edwards, the driver pushes supported SQL operations, like filters and aggregations, directly to JD Edwards and utilizes the embedded SQL engine to process unsupported operations client-side (often SQL functions and JOIN operations).
Connecting to JD Edwards Data
Connecting to JD Edwards data looks just like connecting to any relational data source. Create a connection string using the required connection properties. For this article, you will pass the connection string as a parameter to the create_engine function.
The driver connects to JD Edwards through your Application Interface Services (AIS) Server. Set the following connection properties:
- URL: The base HTTPS URL of your AIS Server (e.g., https://jde-ais.example.com:8300).
- User: Your JD Edwards username.
- Password: Your JD Edwards password.
- Environment (optional): The JD Edwards environment to use (e.g., PD920 for production or DV920 for development). If not specified, the AIS Server's default environment is used.
- Role (optional): The JD Edwards role for the session. If not specified, the AIS Server's default role is used.
- DeviceName (optional): An identifier for the connecting device or application, used for auditing and logging on the AIS Server.
- Jasserver (optional): The specific Java Application Server (JAS) instance to route requests through, useful in clustered environments.
Choosing Which Data Is Exposed
JD Edwards organizes tables and business views by System Code, and the driver exposes each System Code as its own schema. Use these properties to control which schemas are available:
- DataModel: One or more ERP modules (comma-separated) whose System Codes are exposed as schemas, or All to expose every System Code in the connected instance. Defaults to FinancialManagement.
- SystemCodes: A comma-separated list of additional System Codes to expose alongside those from DataModel (e.g., 42,43).
When you connect, the driver sends your credentials to the AIS Server to obtain a session token and caches it. The driver requests a new token automatically before the session expires.
Follow the procedure below to install the required modules and start accessing JD Edwards through Python objects.
Install Required Modules
Use the pip utility to install the pandas & Matplotlib modules and the SQLAlchemy toolkit:
pip install pandas
pip install matplotlib
pip install sqlalchemy
Be sure to import the module with the following:
import pandas
import matplotlib.pyplot as plt
from sqlalchemy import create_engine
Visualize JD Edwards Data in Python
You can now connect with a connection string. Use the create_engine function to create an Engine for working with JD Edwards data.
engine = create_engine("jdedwards:///?URL=https://your-jde-environment-app.example.com&User=admin&Password=myPassword")
Execute SQL to JD Edwards
Use the read_sql function from pandas to execute any SQL statement and store the resultset in a DataFrame.
df = pandas.read_sql("SELECT DocumentNumber, Amount FROM AccountsPayable.AccountLedger WHERE BusinessUnit = '100'", engine)
Visualize JD Edwards Data
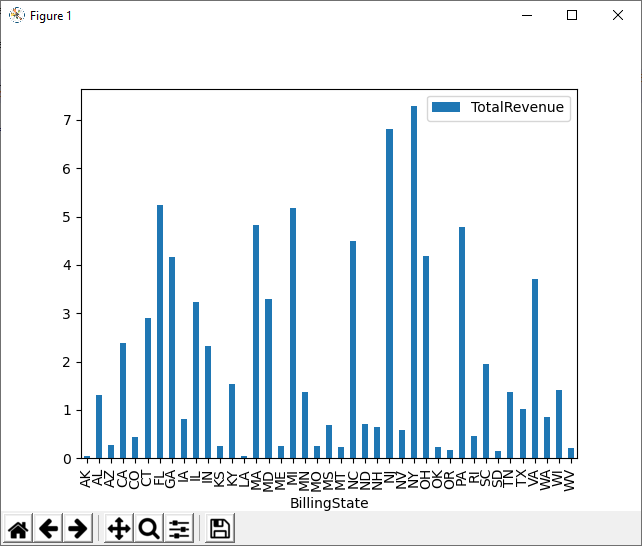
With the query results stored in a DataFrame, use the plot function to build a chart to display the JD Edwards data. The show method displays the chart in a new window.
df.plot(kind="bar", x="DocumentNumber", y="Amount")
plt.show()
Free Trial & More Information
Download a free, 30-day trial of the CData Python Connector for JD Edwards to start building Python apps and scripts with connectivity to JD Edwards data. Reach out to our Support Team if you have any questions.
Full Source Code
import pandas
import matplotlib.pyplot as plt
from sqlalchemy import create_engin

engine = create_engine("jdedwards:///?URL=https://your-jde-environment-app.example.com&User=admin&Password=myPassword")
df = pandas.read_sql("SELECT DocumentNumber, Amount FROM AccountsPayable.AccountLedger WHERE BusinessUnit = '100'", engine)

df.plot(kind="bar", x="DocumentNumber", y="Amount")
plt.show()
Ready to get started?
Download a free trial of the JD Edwards Connector to get started:
Download NowLearn more:
 JD Edwards Python Connector
Python Connector Libraries for JD Edwards Data Connectivity. Integrate JD Edwards with popular Python tools like Pandas, SQLAlchemy, Dash & petl.