




Build Visualizations of LINE Data in Birst

Birst is a cloud business intelligence (BI) tool and analytics platform that helps organizations quickly understand and optimize complex processes. When paired with the CData API Driver for JDBC, you can connect to live LINE data through the Birst Cloud Agent and build real-time visualizations. In this article, we walk you through, step-by-step, how to connect to LINE using the Cloud Agent and create dynamic reports in Birst.
With powerful data processing capabilities, the CData JDBC driver offers unmatched performance for live LINE data operations in Birst. When you issue complex SQL queries from Birst to LINE, the driver pushes supported SQL operations, like filters and aggregations, directly to LINE and utilizes the embedded SQL Engine to process unsupported operations client-side (often SQL functions and JOIN operations). With built-in dynamic metadata querying, the JDBC driver enables you to visualize and analyze LINE data using native Birst data types.
Configure a JDBC Connection to LINE Data in Birst
Before creating the Birst project, you will need to install the Birst Cloud Agent (in order to work with the installed JDBC Driver). Also, copy the JAR file for the JDBC Driver (and the LIC file, if it exists) to the /drivers/ directory in the installation location for the Cloud Agent.
With the driver and Cloud Agent installed, you are ready to begin.
- Create a new project in Birst.
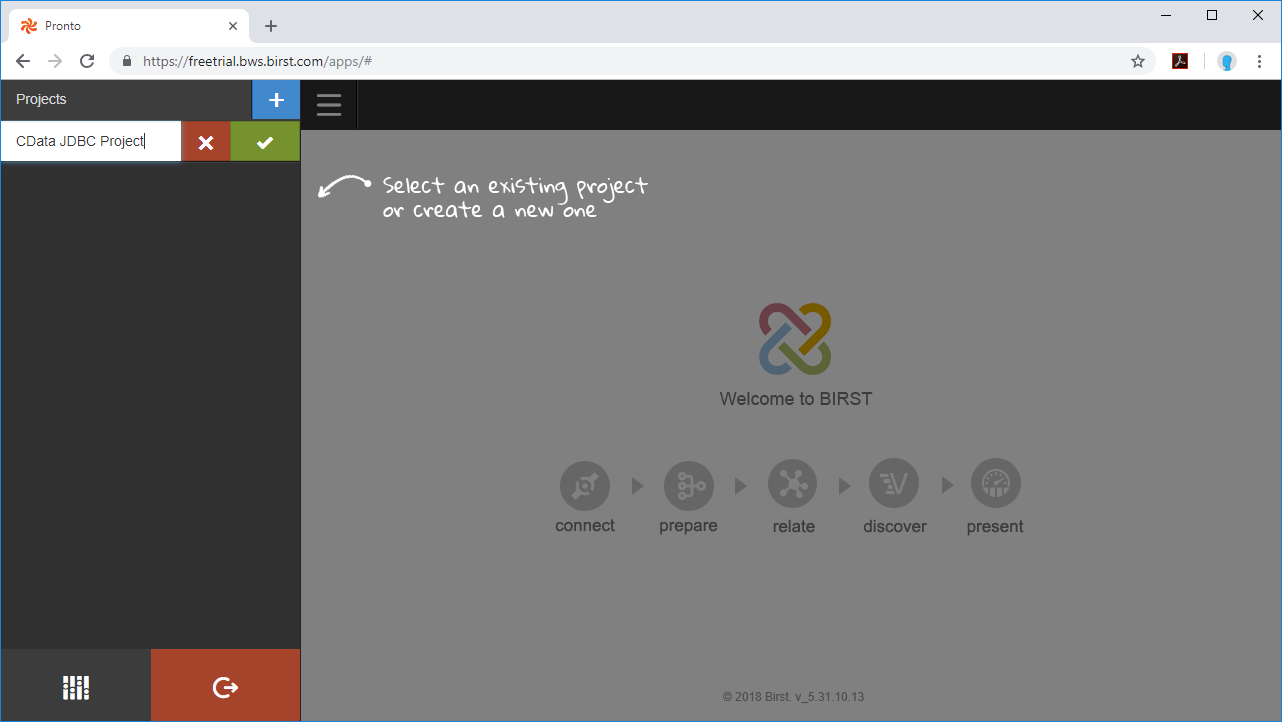
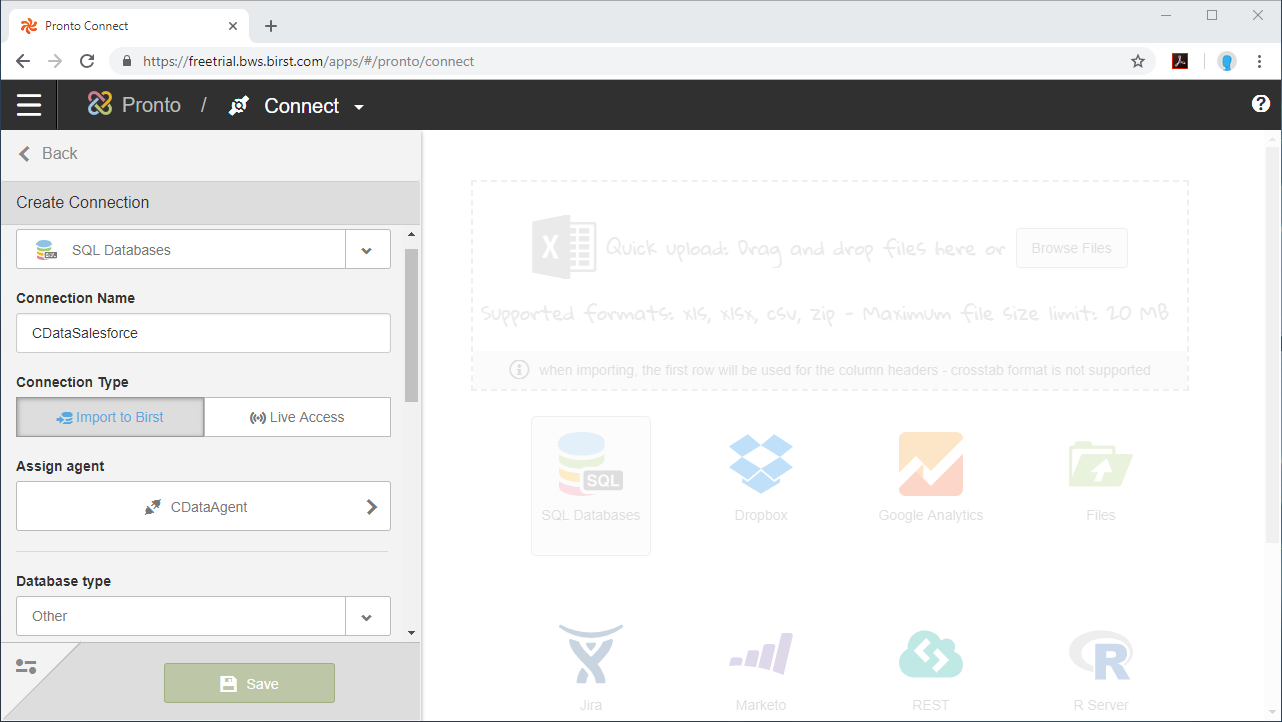
- Name the connection (e.g. CDataAPI).
- Choose Live Access.
- Select an agent.
- Set Database Type to Other.
- Set SQL Type to MSSQL
- Set the Connection string.
Start by setting the Profile connection property to the location of the LINE Profile on disk (e.g. C:\profiles\LINE.apip). Next, set the ProfileSettings connection property to the connection string for LINE (see below).
LINE API Profile Settings
The LINE Messaging API uses Channel Access Token authentication. To obtain a Channel Access Token:
- Log in to the LINE Developers Console at https://developers.line.biz
- Select your provider and open your Messaging API channel.
- Navigate to the Messaging API tab.
- Under Channel access token, click Issue to generate a long-lived token.
- Copy the generated token.
After obtaining your Channel Access Token, set the following connection properties:
- AuthScheme: Set this to APIKey.
Set the following in the ProfileSettings connection property:
- APIKey: Set this to your LINE Channel Access Token.
Built-in Connection String Designer
For assistance in constructing the JDBC URL, use the connection string designer built into the LINE JDBC Driver. Either double-click the JAR file or execute the jar file from the command-line.
java -jar cdata.jdbc.api.jarFill in the connection properties and copy the connection string to the clipboard.
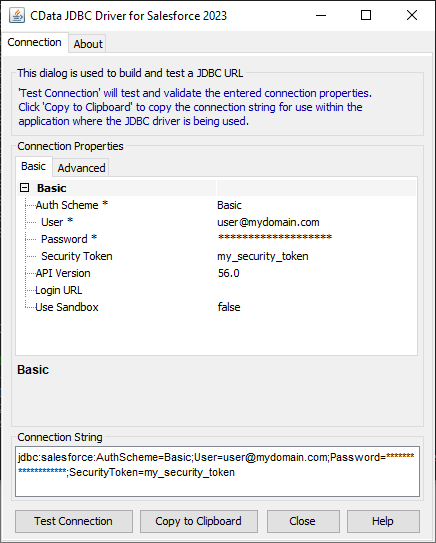
When you configure the JDBC URL, you may also want to set the Max Rows connection property. This will limit the number of rows returned, which is especially helpful for improving performance when designing reports and visualizations.
Below is a typical JDBC connection string for LINE:
jdbc:api:Profile=C:\profiles\LINE.apip;ProfileSettings='APIKey=your_channel_access_token;';AuthScheme=APIKey; - Set the Driver Name: cdata.jdbc.api.APIDriver and click Save.
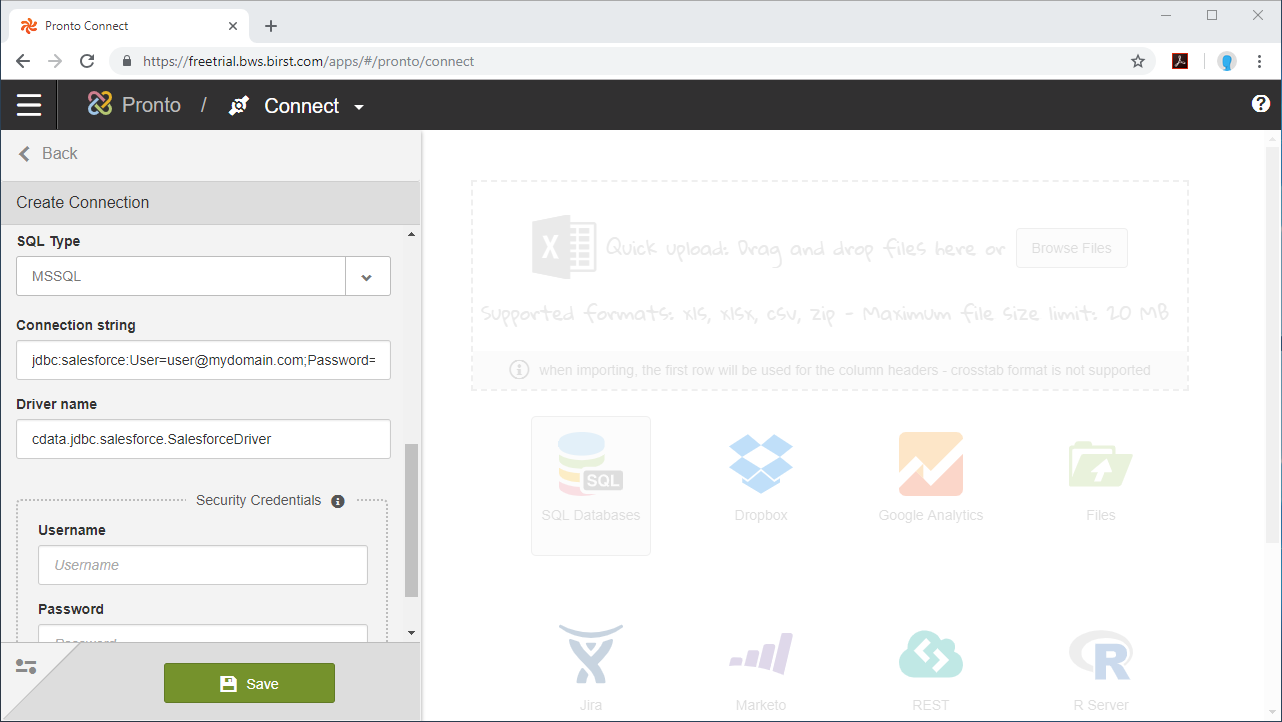
NOTE: Since authentication to LINE is managed from the connection string, you can leave Security Credentials blank.
Configure LINE Data Objects
Now that the connection is configured, we are ready to configure the schema for the dataset, choosing the tables, views, and columns we wish to visualize.
- Select the Schema (e.g. API).
- Click on Tables and/or Views to connect to those entities and click Apply.
- Select the Tables and Columns you want to access and click Done.
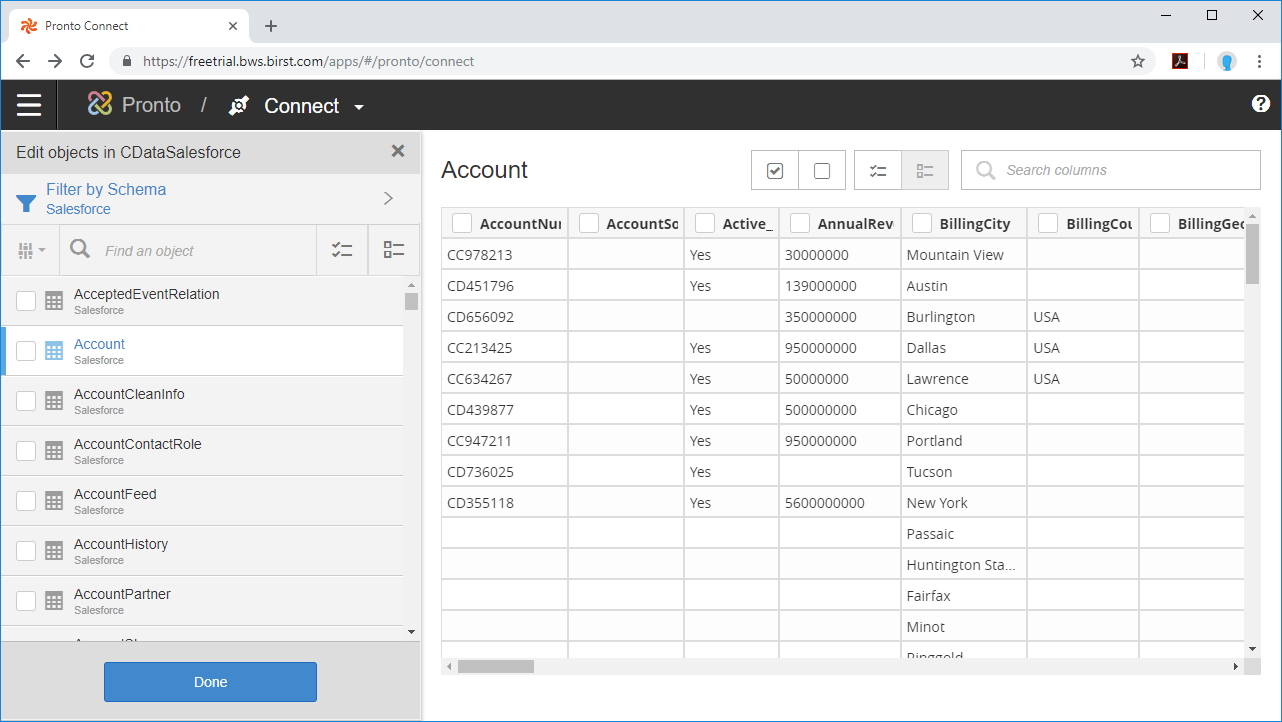
With the objects configured, you can perform any data preparation and discover any relationships in your data using the Pronto Prepare and Relate tools.
Build a Visualization
After you prepare your data and define relationships between the connected objects, you are ready to build your visualization.
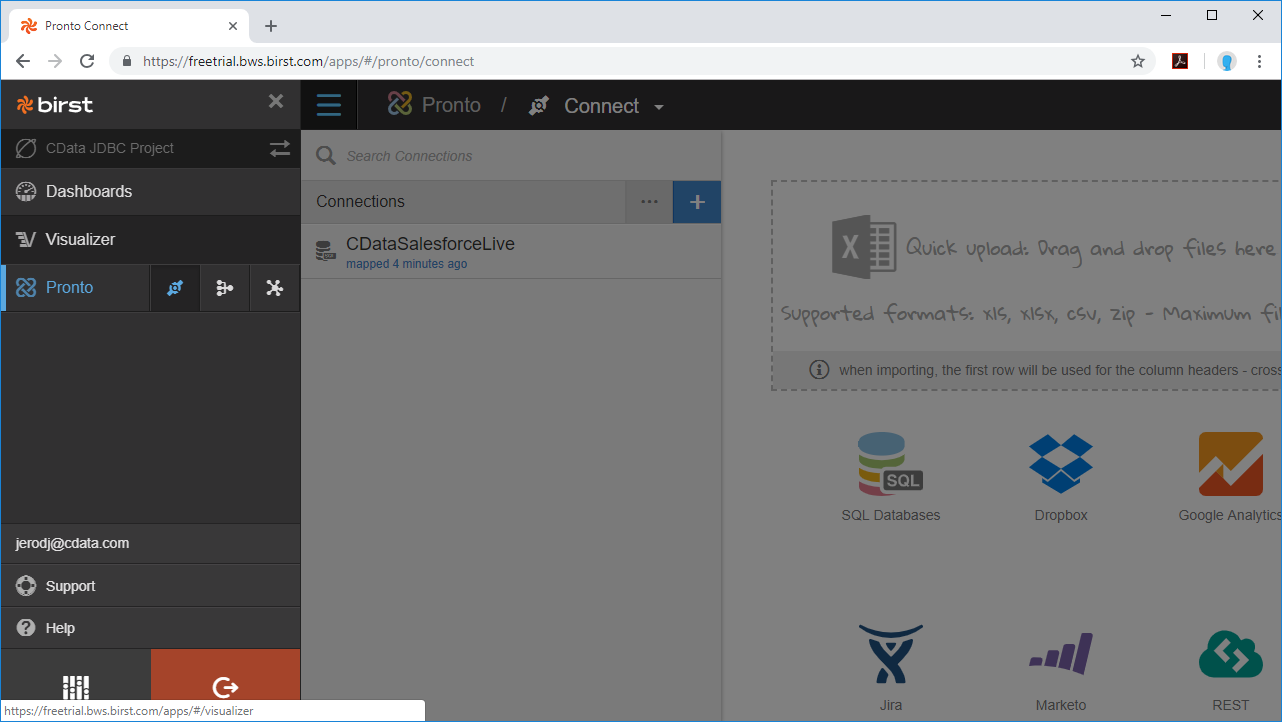
- Select the Visualizer tool from the menu.
- Select Measures & Categories from your objects
- Select and configure the appropriate visualization for the Measure(s) you selected.
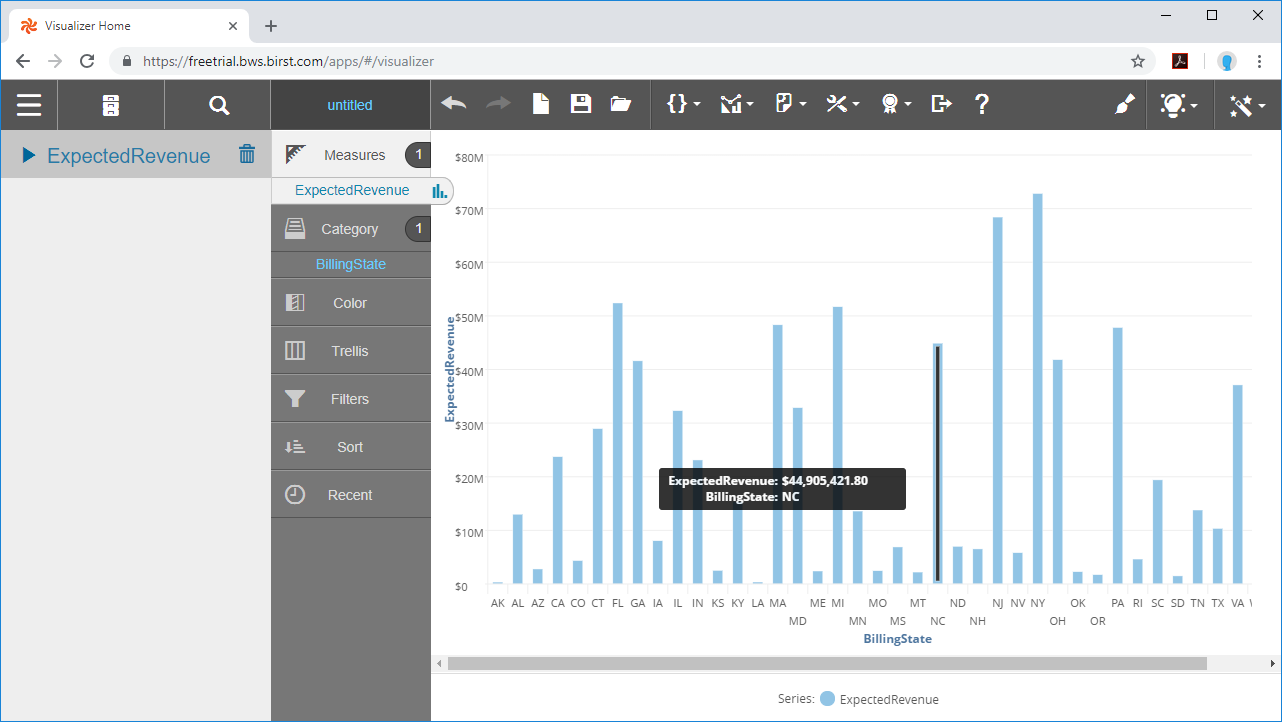
Using the CData API Driver for JDBC with the Cloud Agent and Birst, you can easily create robust visualizations and reports on LINE data. Download a free, 30-day trial and start building Birst visualizations today.