




Create Dashboards and Visualize Live Linear Data in Geckoboard

Geckoboard is a business intelligence tool that simplifies the visualization of key performance indicators (KPIs) by creating live dashboards. It allows teams to consolidate data from various sources - such as Salesforce, Snowflake, Google Analytics, and spreadsheets - and display it in a visually engaging and easy-to-understand format. Designed for simplicity and clarity, Geckoboard helps businesses monitor performance, track goals, and make data-driven decisions.
When used with CData Connect AI, you gain instant, cloud-to-cloud access to Linear data from Geckoboard for dashboards, monitoring, visualizations, and more. This article explains how to connect to Linear and create visualizations using Linear data in Geckoboard.
CData Connect AI offers a seamless SQL Server, cloud-to-cloud interface for Linear, enabling you to effortlessly create dashboards and visualizations using live Linear data in Geckoboard. While building visualizations, Geckoboard requires SQL queries to retrieve the necessary data. With built-in optimized data processing, CData Connect AI pushes all supported SQL operations (such as filters and JOINs) directly to Linear, utilizing server-side processing for fast and efficient data retrieval of Linear data.
Configure Linear connectivity for Geckoboard
Connectivity to Linear from Geckoboard is made possible through CData Connect AI. To work with Linear data from Geckoboard, we start by creating and configuring a Linear connection.
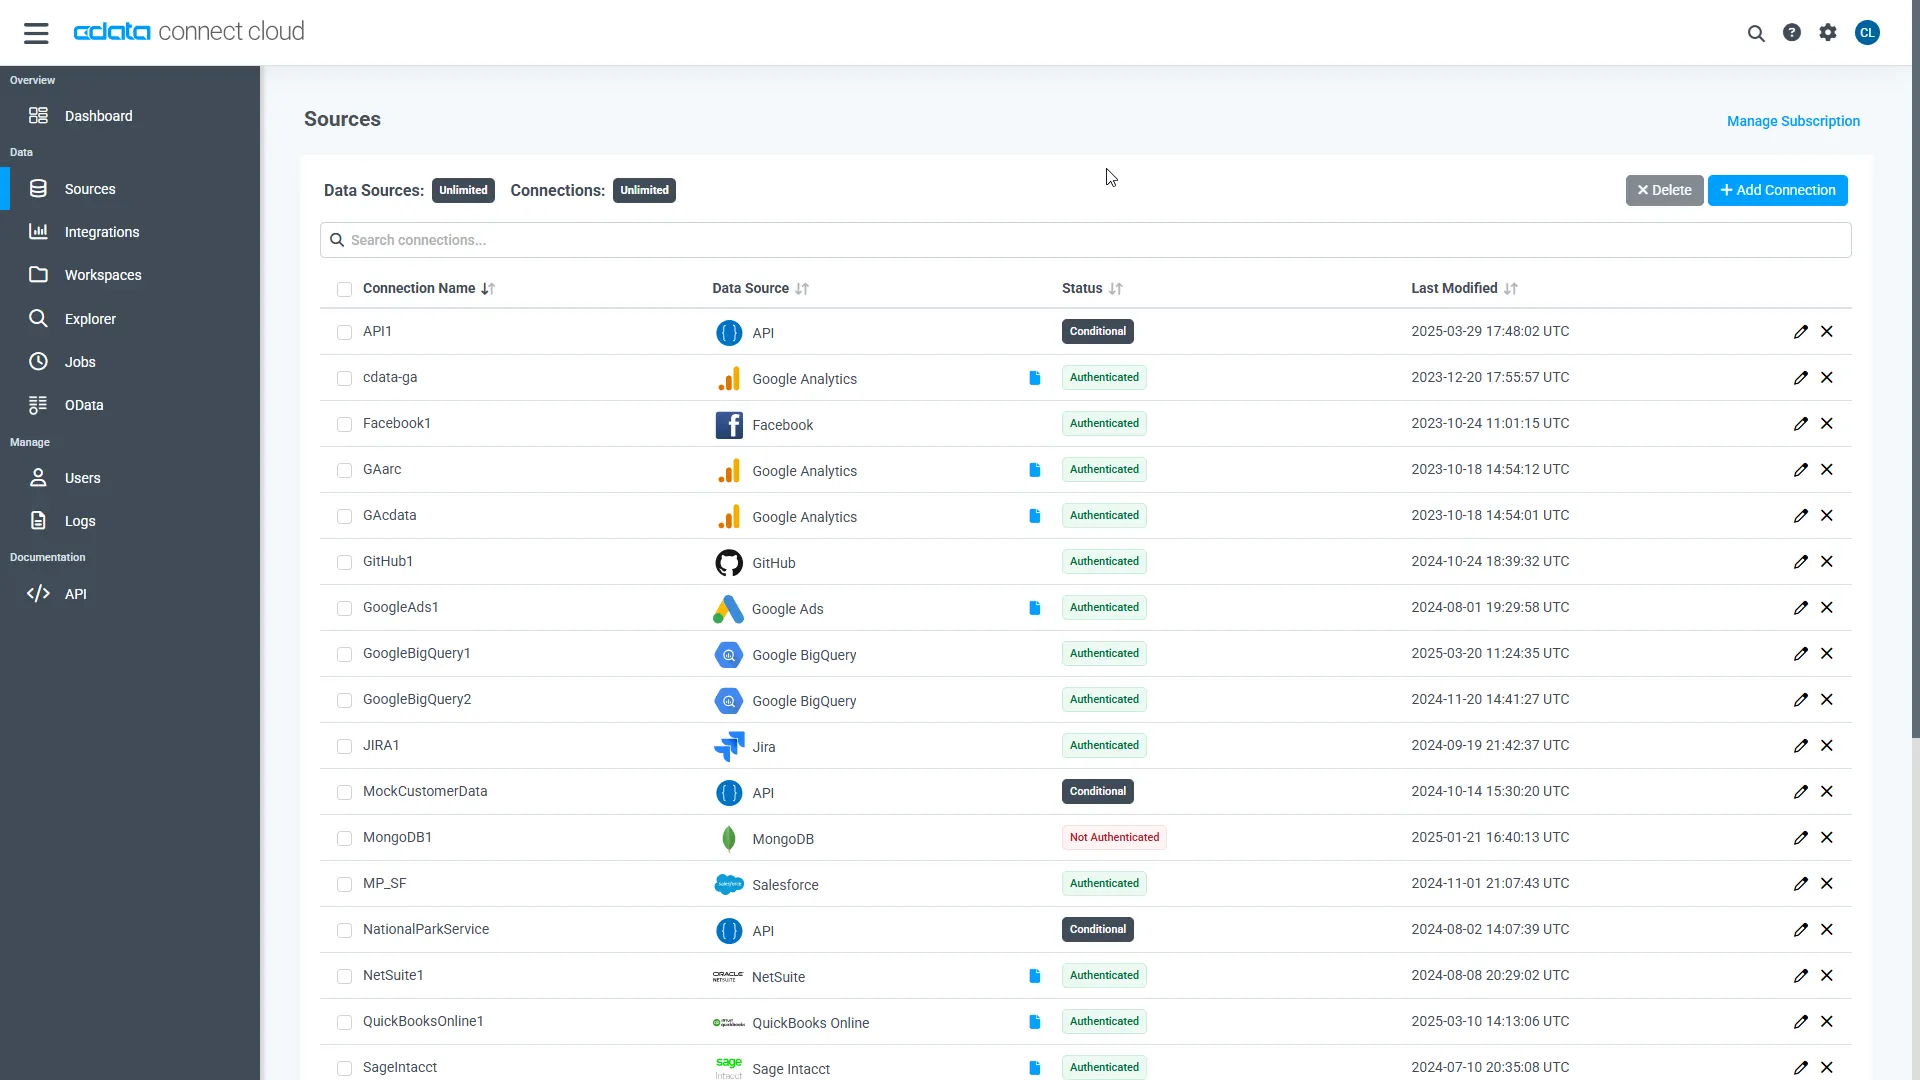
- Log into Connect AI, click Sources, and then click Add Connection
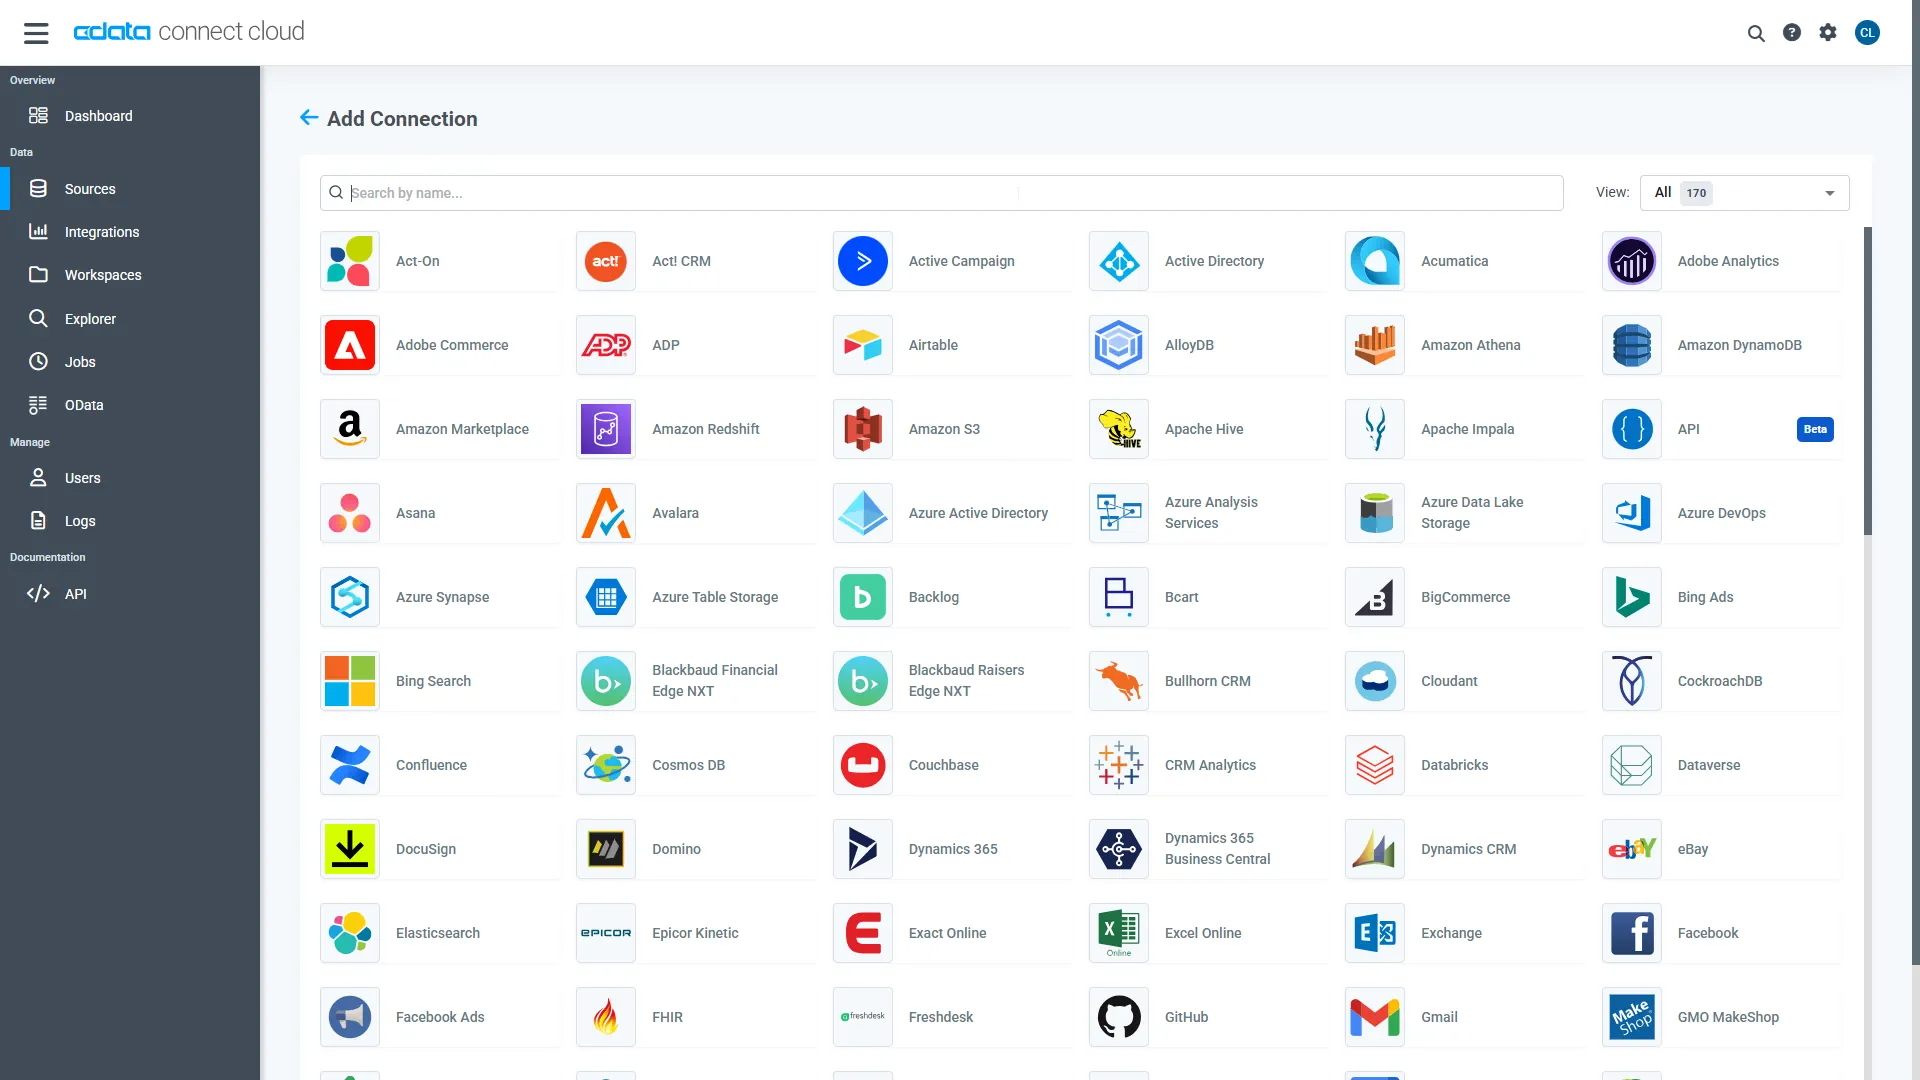
- Select "Linear" from the Add Connection panel
-
Enter the necessary authentication properties to connect to Linear.
You can authenticate to Linear with a personal API key or with OAuth 2.0. The API key is the simplest option for connecting with your own Linear account.
Authenticating with an API Key
Set the following connection properties:
- AuthScheme: Set this to APIKey.
- APIKey: A Linear personal API key.
To create a personal API key, log in to Linear, open Settings > Security & access > Personal API keys, select New API key, and create it. Copy the key immediately, because Linear shows it only once.
Authenticating with OAuth
OAuth requires a custom OAuth application registered in Linear (Settings > API > OAuth applications), which provides the OAuthClientId and OAuthClientSecret. Two flows are supported:
- Authorization code: Set AuthScheme to OAuth, InitiateOAuth to GETANDREFRESH, and provide OAuthClientId, OAuthClientSecret, and the CallbackURL defined in your application (e.g., http://localhost:33333). The driver opens Linear in your browser so you can grant access.
- Client credentials: Set AuthScheme to OAuthClient and provide OAuthClientId and OAuthClientSecret. This authenticates the application itself, with no browser interaction, and suits machine-to-machine integrations.
By default, the driver requests the read,write scopes. The driver refreshes the access token automatically when it expires.
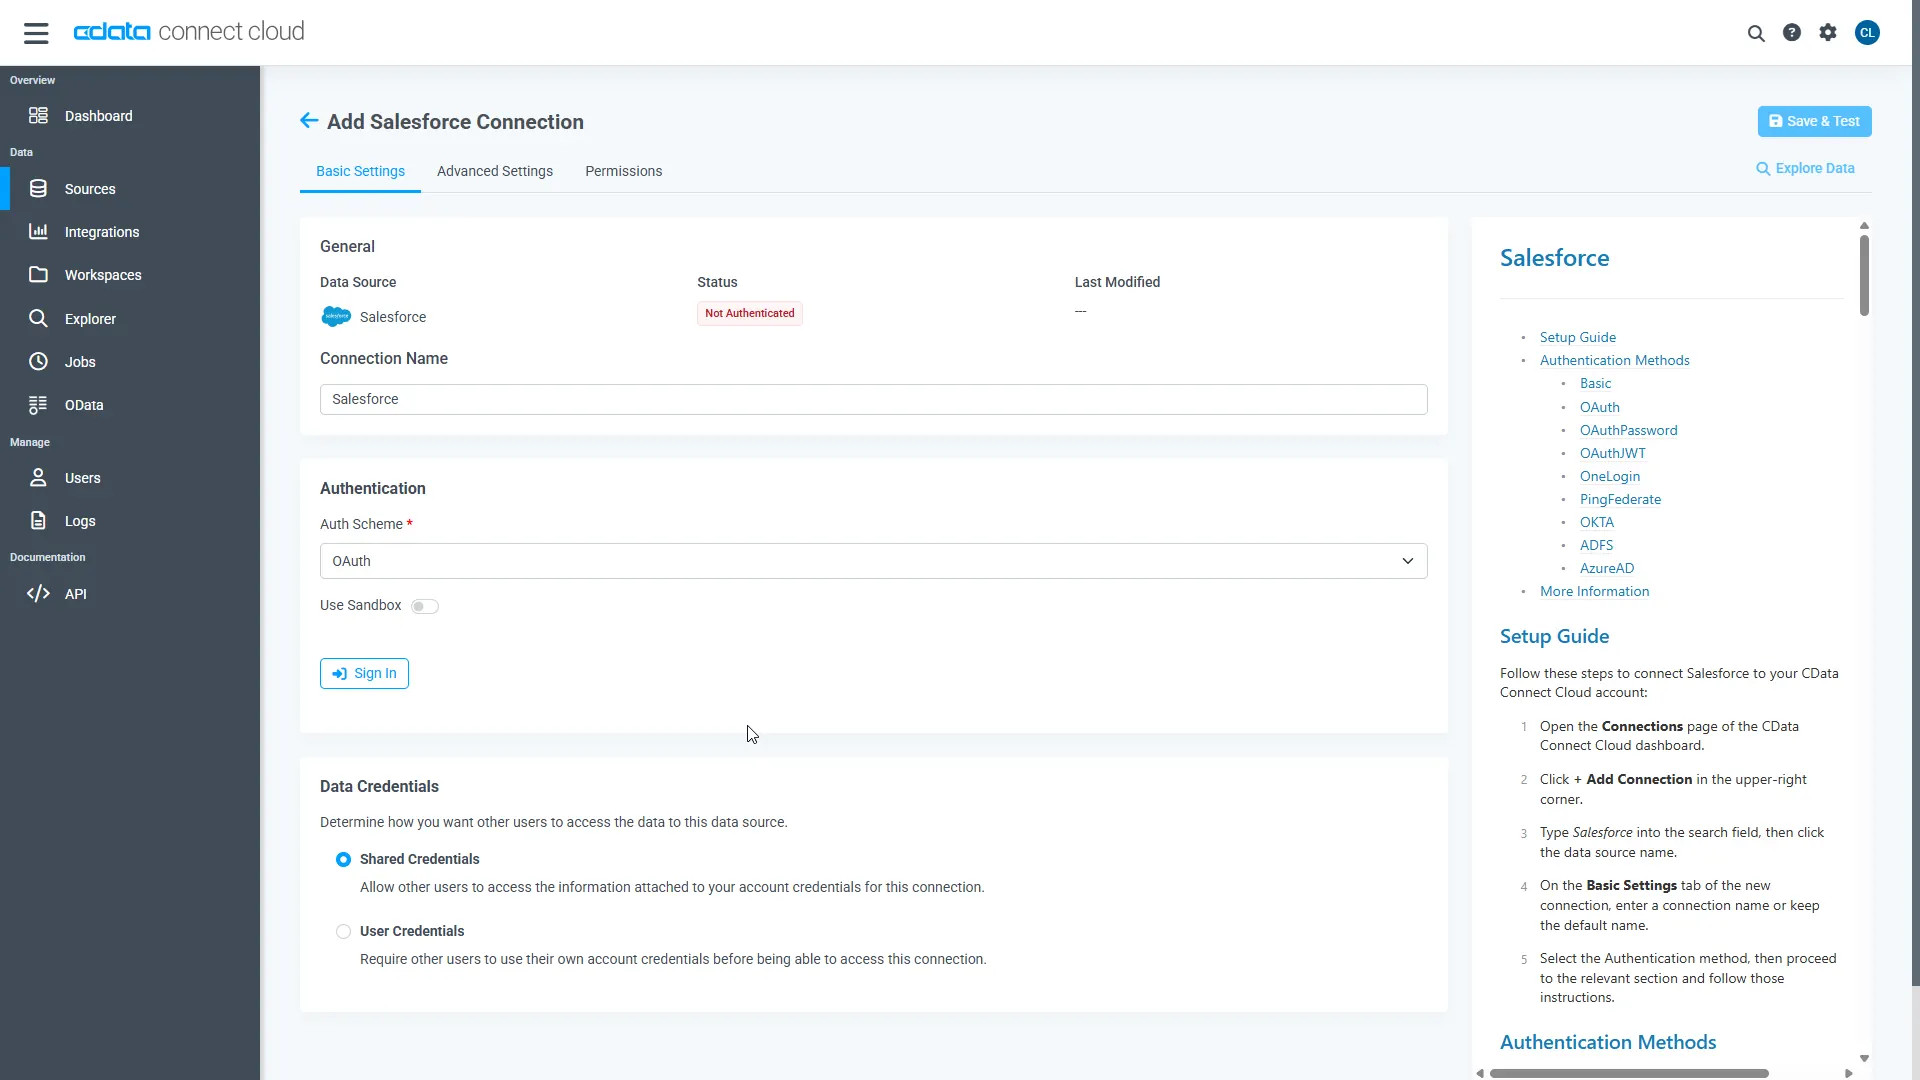
- Click Save & Test
-
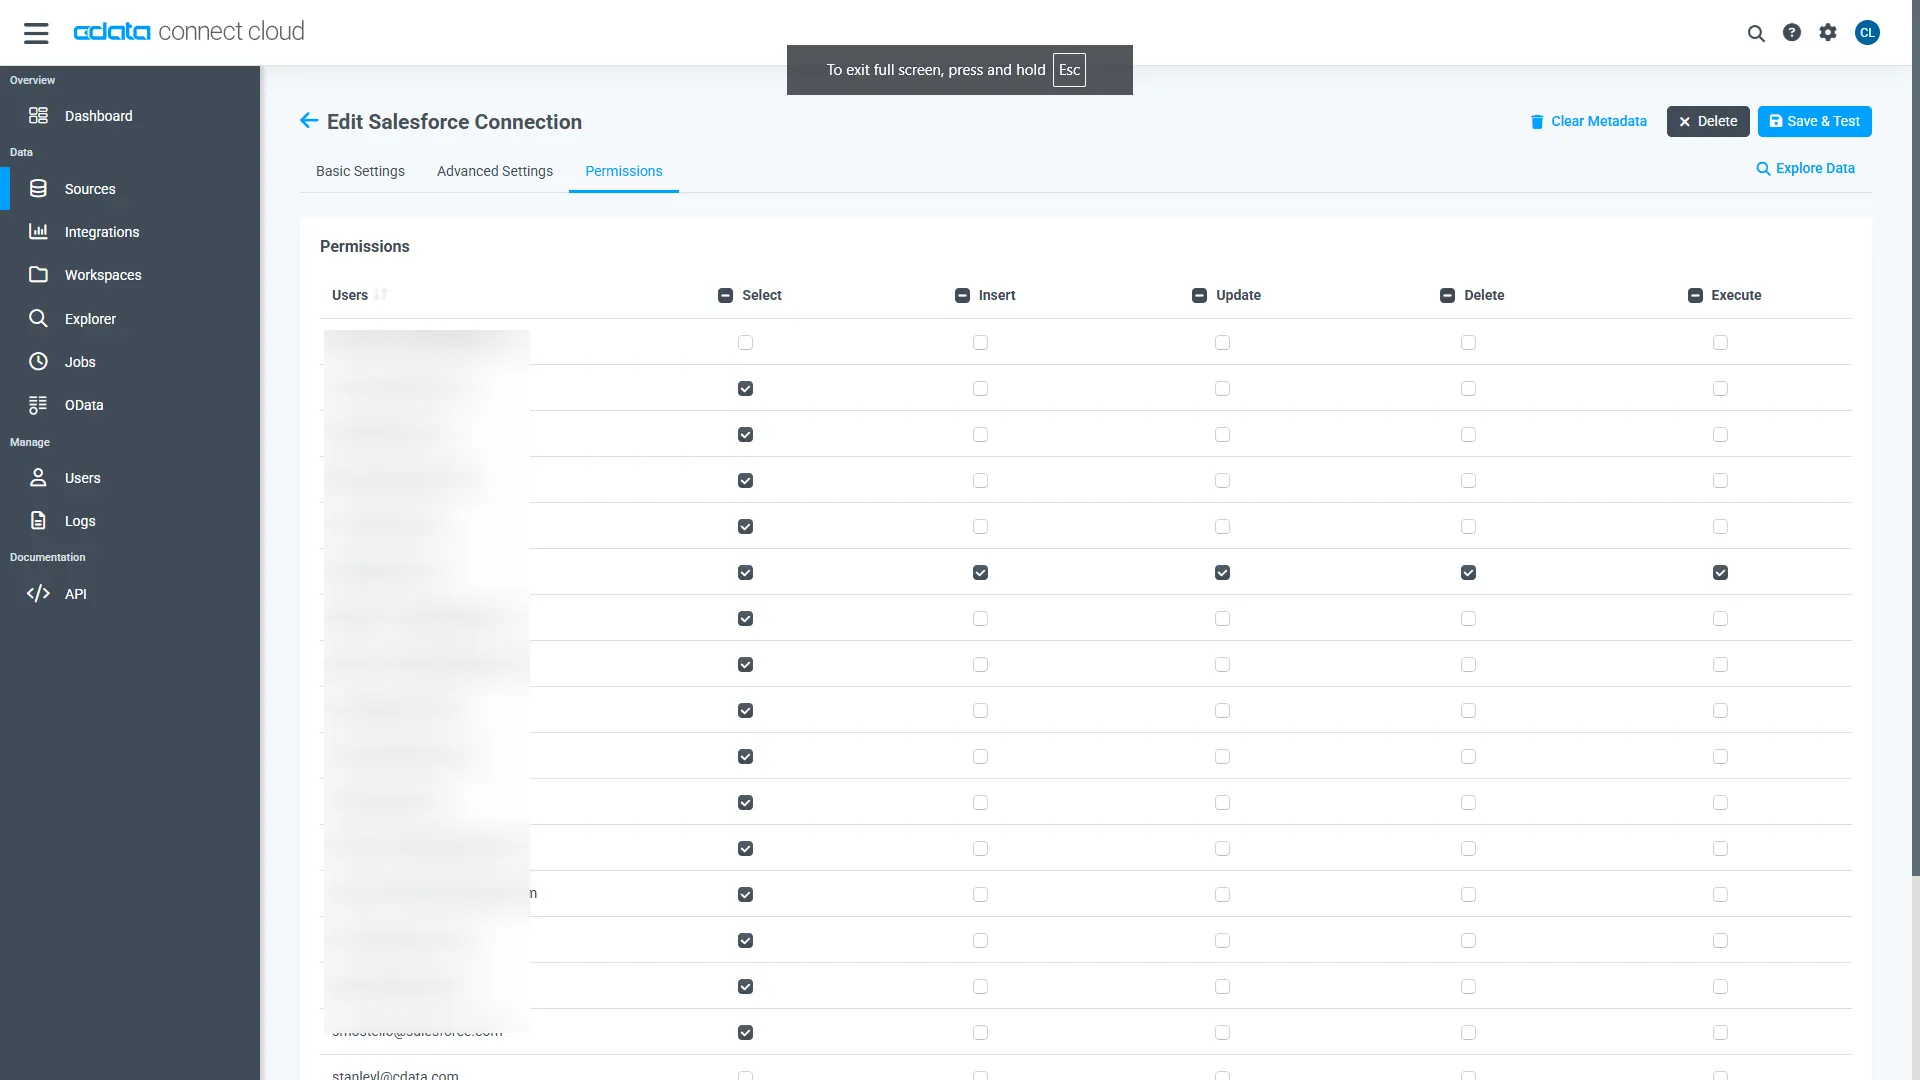
Navigate to the Permissions tab in the Add Linear Connection page and update the User-based permissions.
Add a Personal Access Token
When connecting to Connect AI through the REST API, the OData API, or the Virtual SQL Server, a Personal Access Token (PAT) is used to authenticate the connection to Connect AI. It is best practice to create a separate PAT for each service to maintain granularity of access.
- Click on the Gear icon () at the top right of the Connect AI app to open the settings page.
- On the Settings page, go to the Access Tokens section and click Create PAT.
-
Give the PAT a name and click Create.
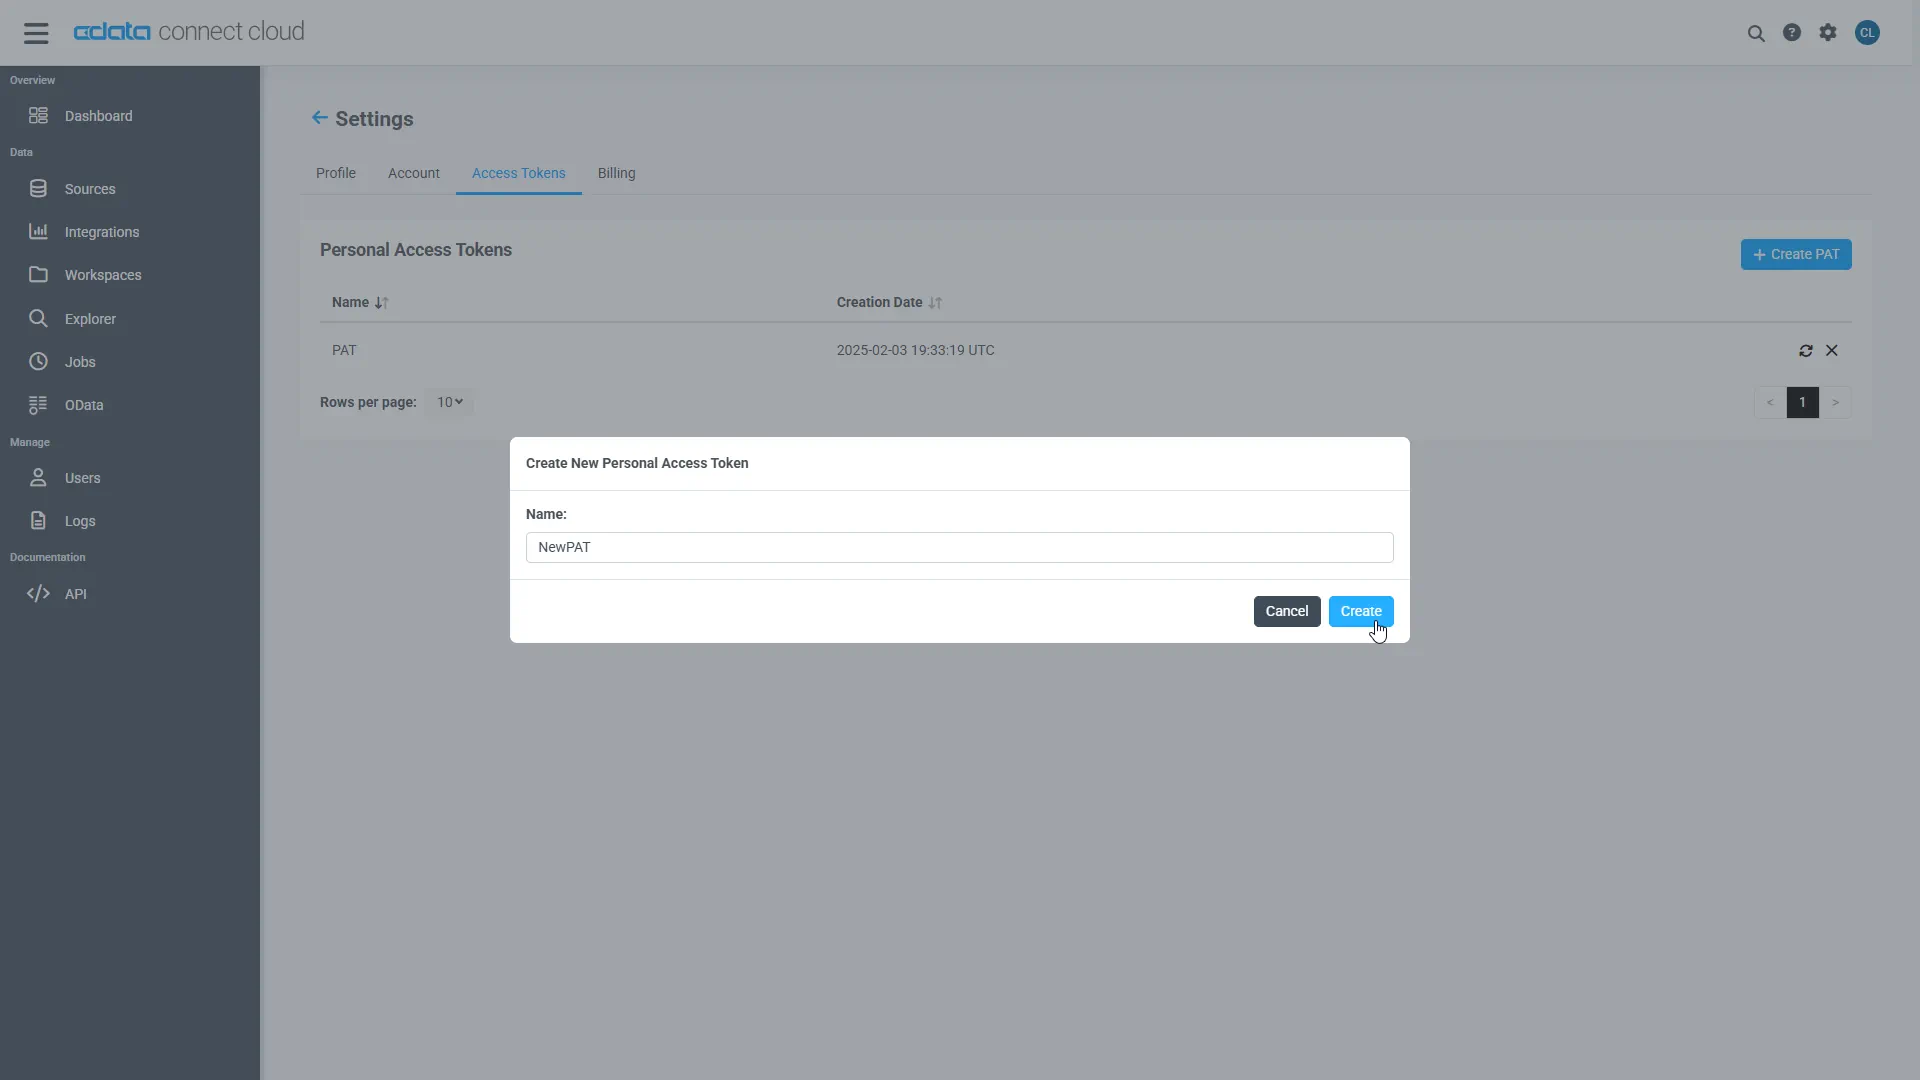
- The personal access token is only visible at creation, so be sure to copy it and store it securely for future use.
With the connection configured and a PAT generated, you are ready to connect to Linear data from Geckoboard.
Connect live Linear data in Geckoboard
Follow these steps to establish a connection from Geckoboard to the CData Connect AI Virtual SQL Server API.
- Log into Geckoboard
- Add a custom dashboard name and click Add widget
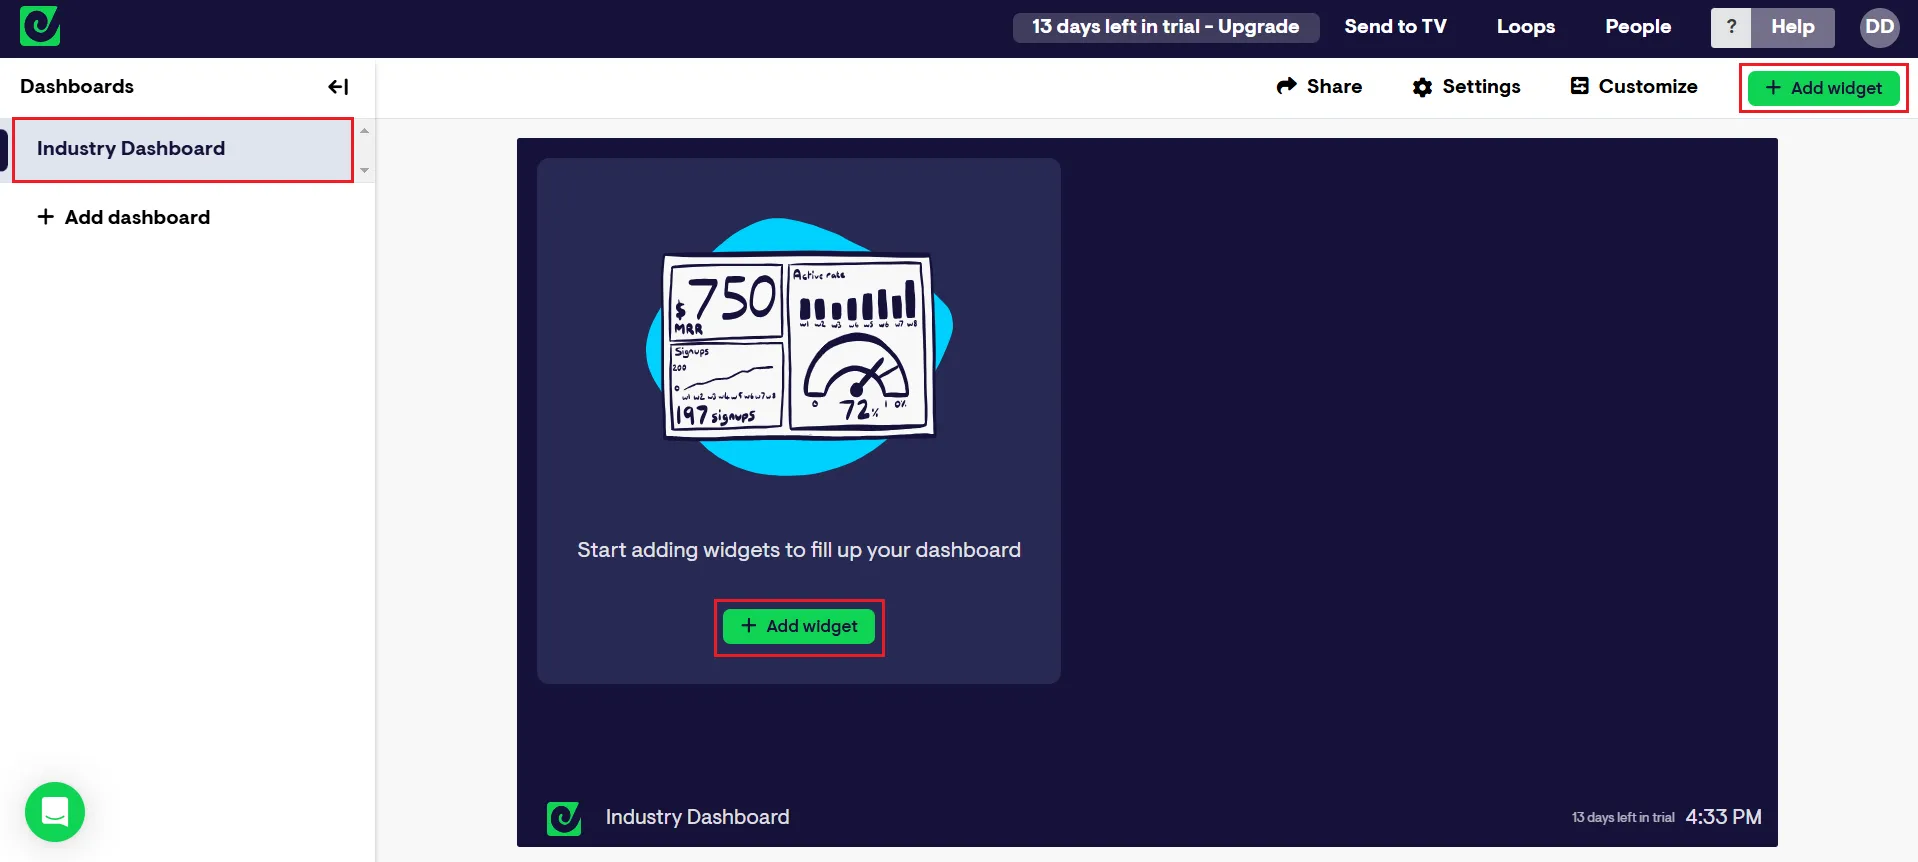
- Search for "Databases" in the Connect your data search bar
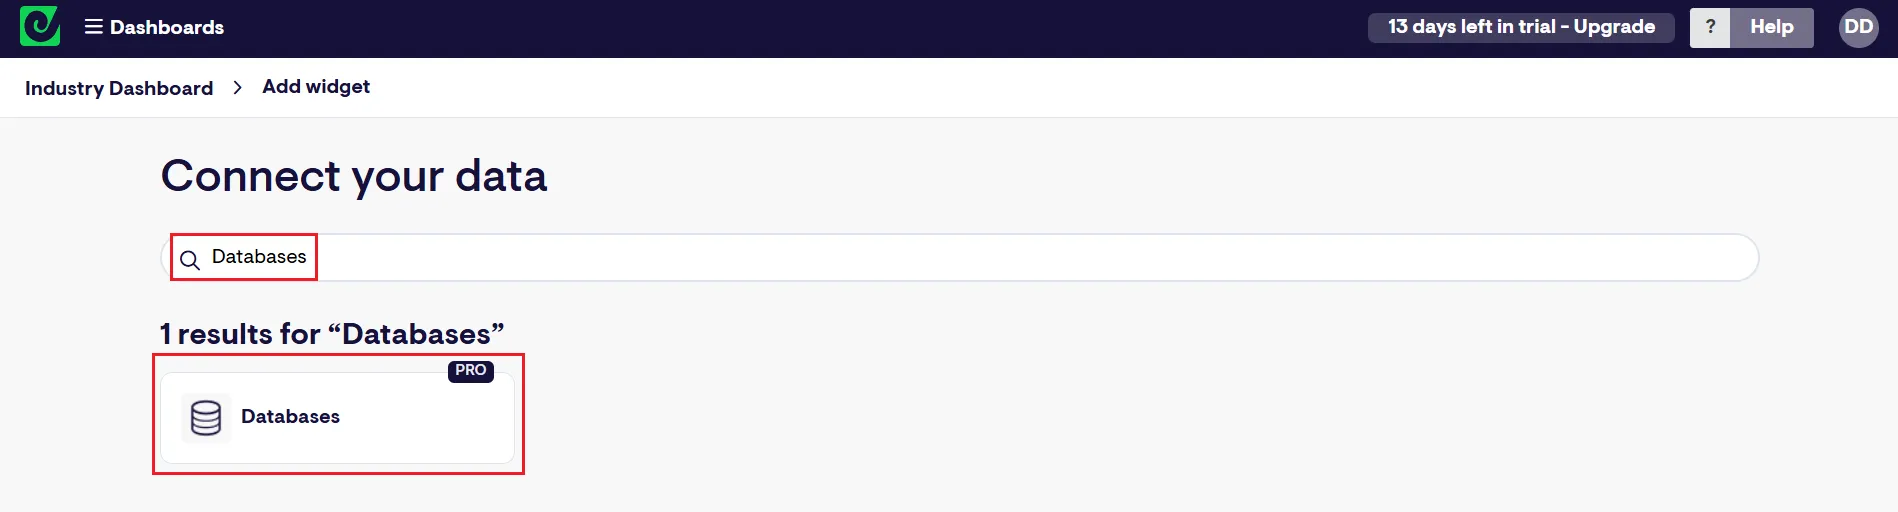
- Select SQL Server as the Database type
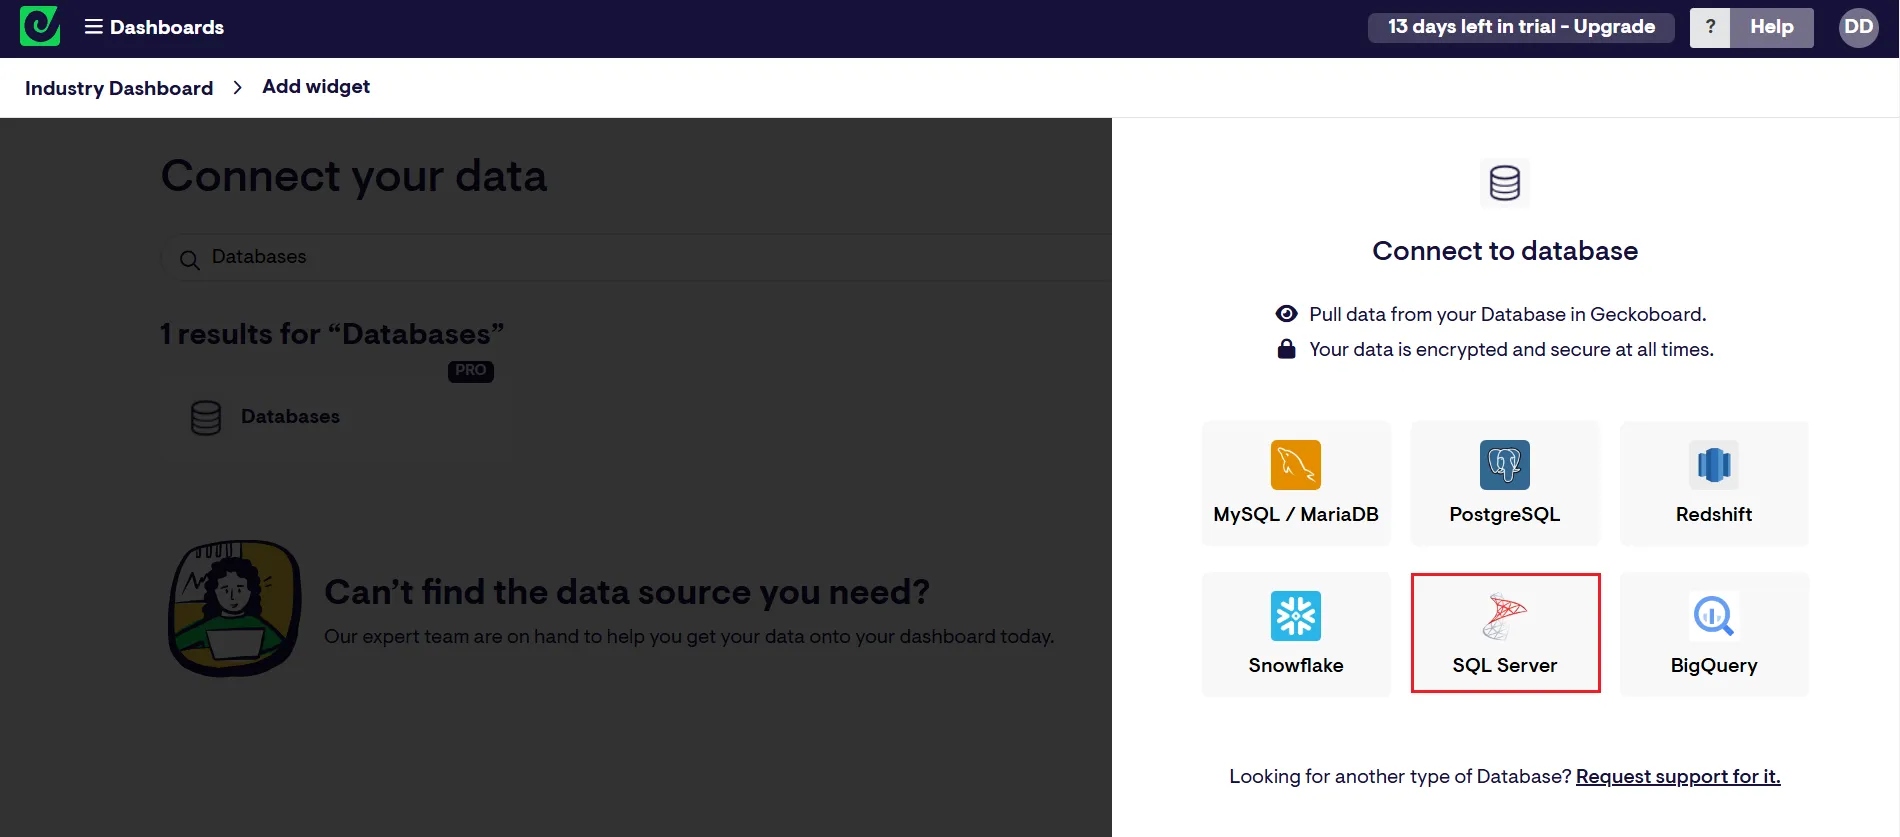
- Fill in the connection details:
- Connection name: enter a name for the connection to CData Connect AI
- Host: enter the Virtual SQL Server endpoint: tds.cdata.com
- Port: : enter 14333
- Database name: enter the Connection Name of the CData Connect AI data source you want to connect to (for example, Linear1)
- Username: enter your CData Connect AI username. This is displayed in the top-right corner of the CData Connect AI interface. For example, [email protected]
- Password: enter the PAT you generated on the Settings page
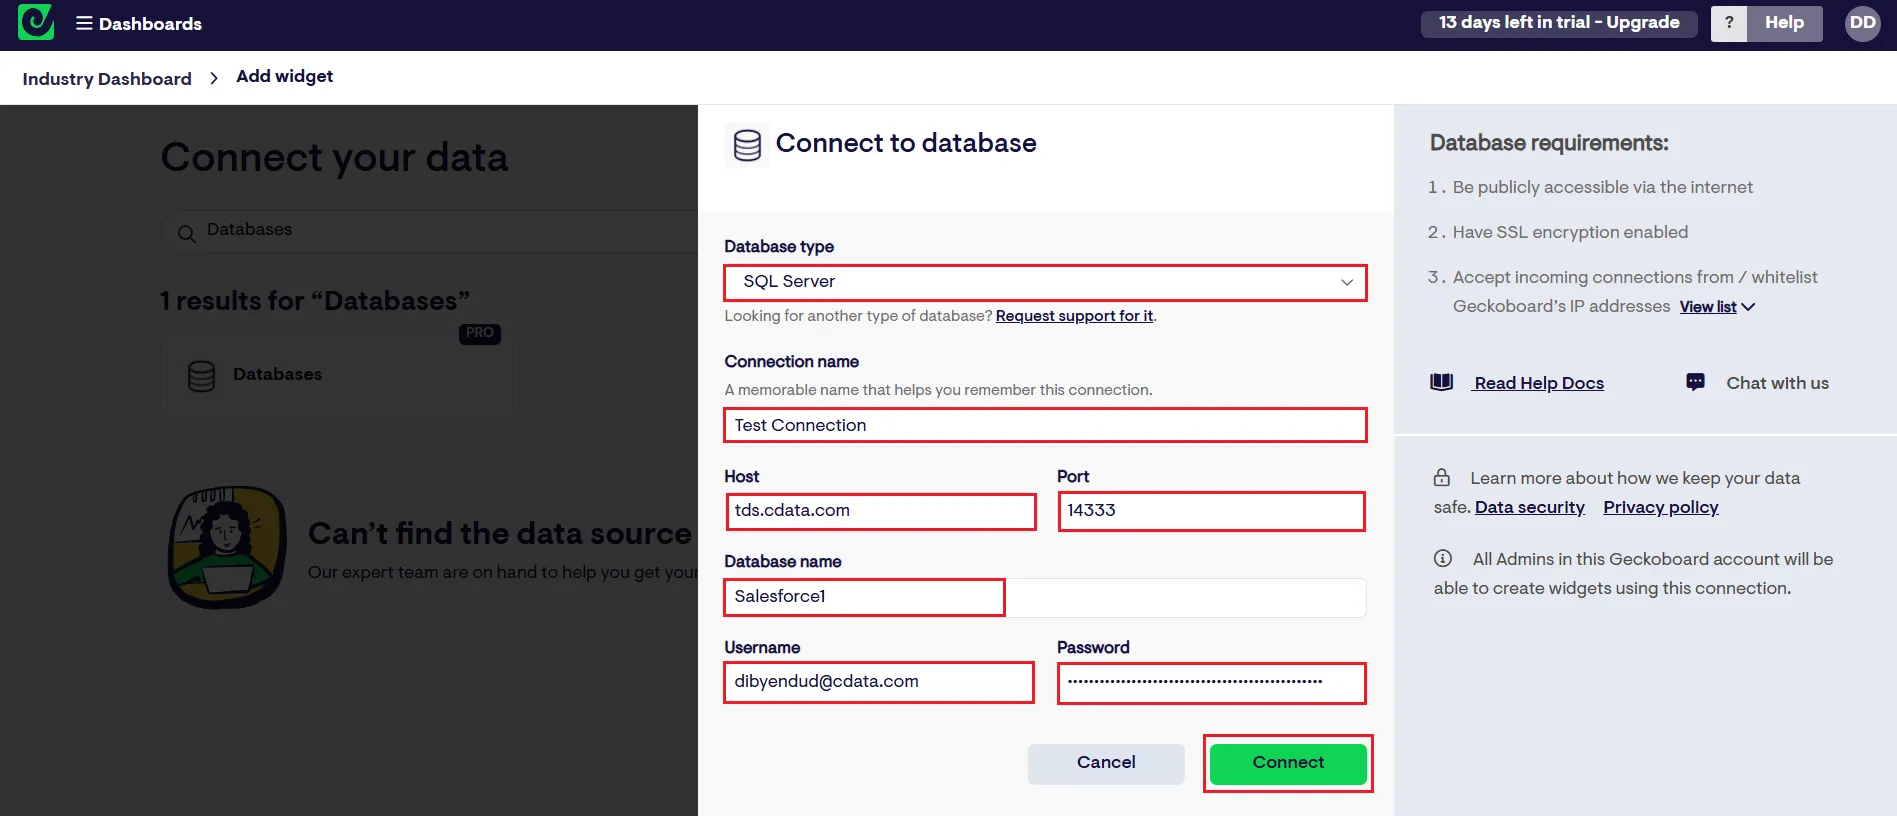
- Click Connect
After successfully configuring your connection, you can query and visualize your Linear data.
Visualize live Linear data in Geckoboard
To visualize live Linear data in Geckoboard, follow these steps:
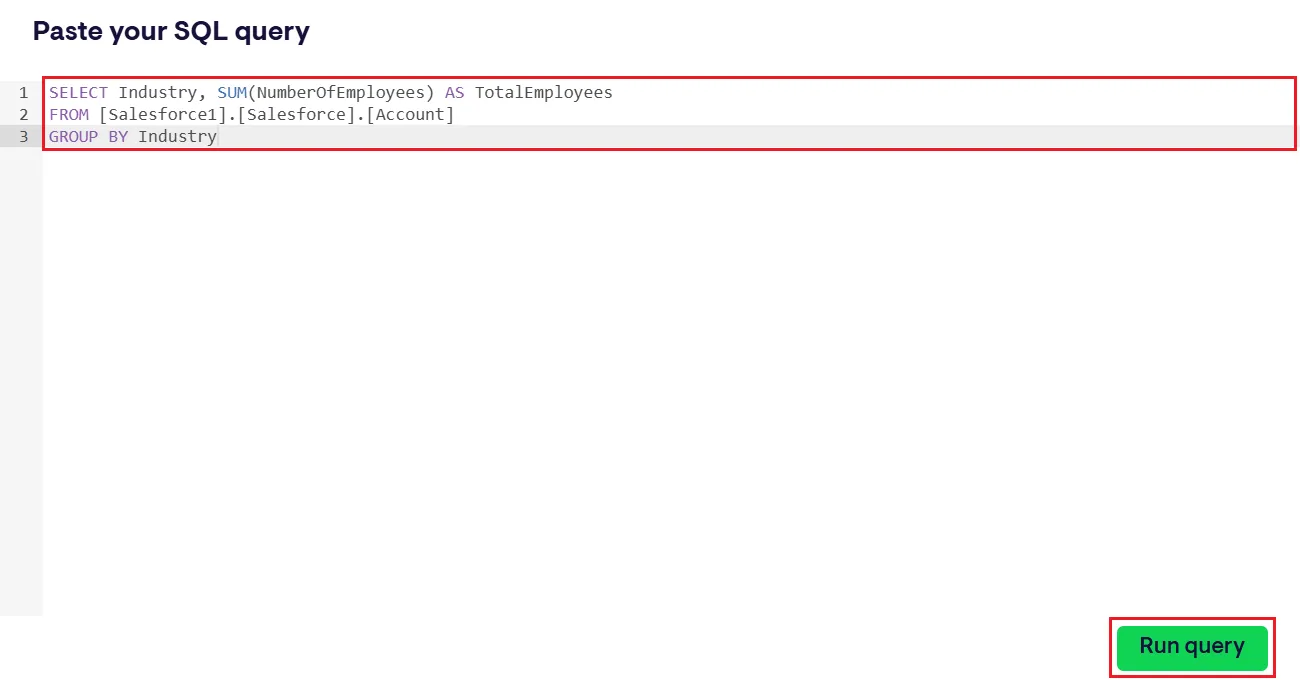
- Write an SQL query to select the specific Linear data needed for visualization in Paste your SQL query compiler screen
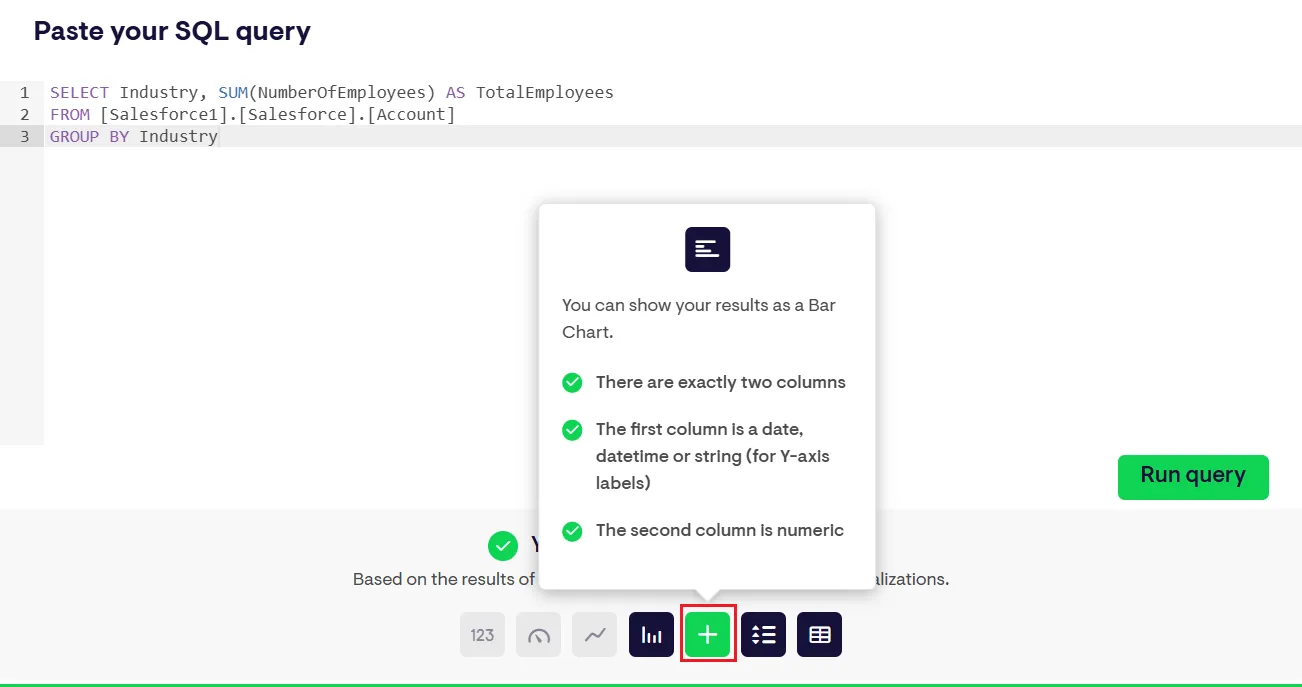
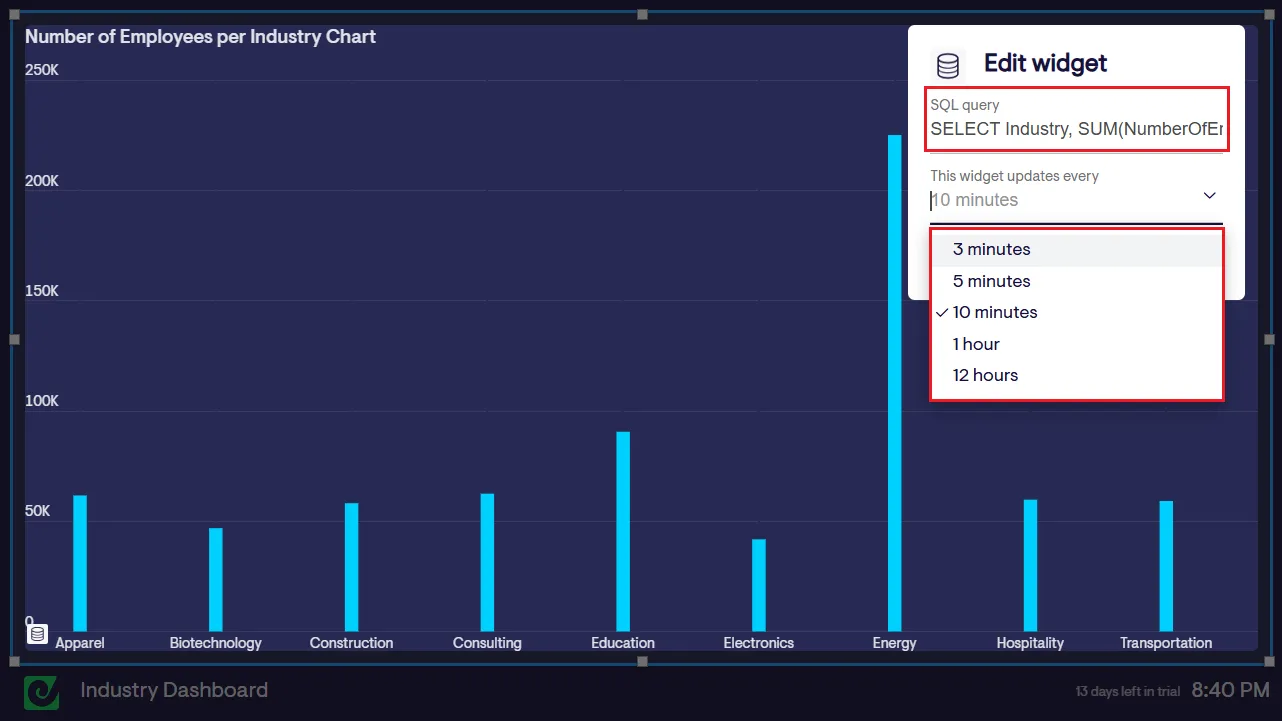
- Choose the visualization type (Line Chart, Bar Chart, or Column Chart) that best suits your business requirements
- The selected chart will be displayed on Geckoboard
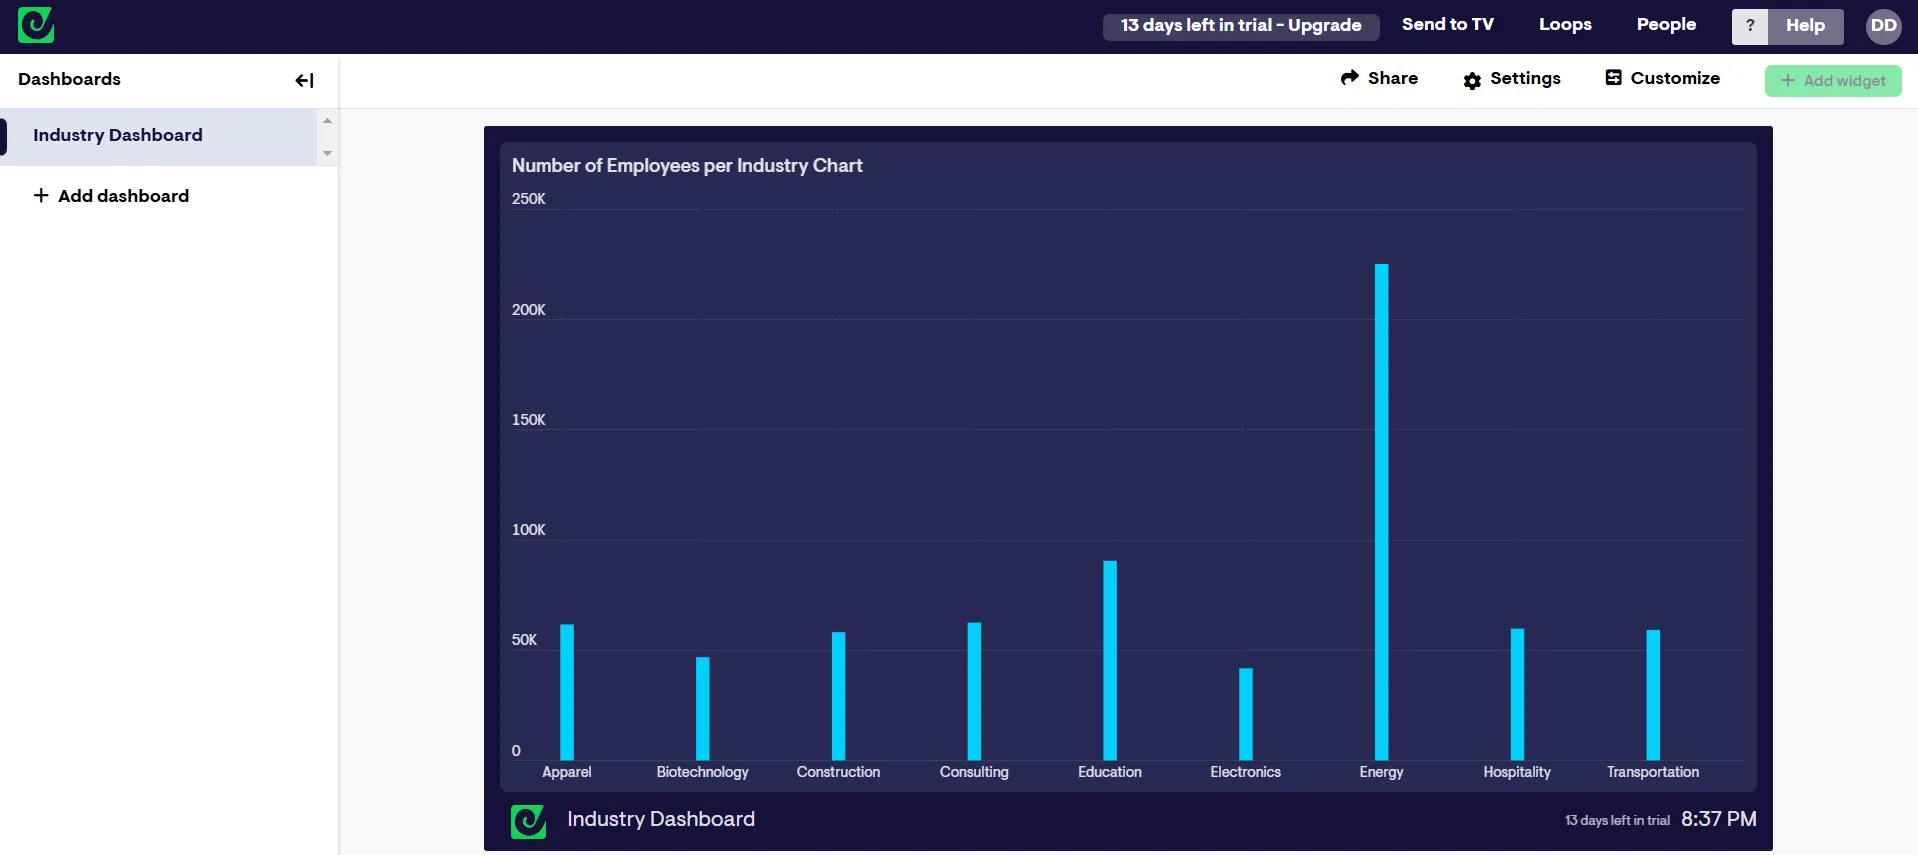
- Click the menu (three dots in the top-right corner of the graph) and select Edit to modify the SQL query or set a refresh interval for the chart
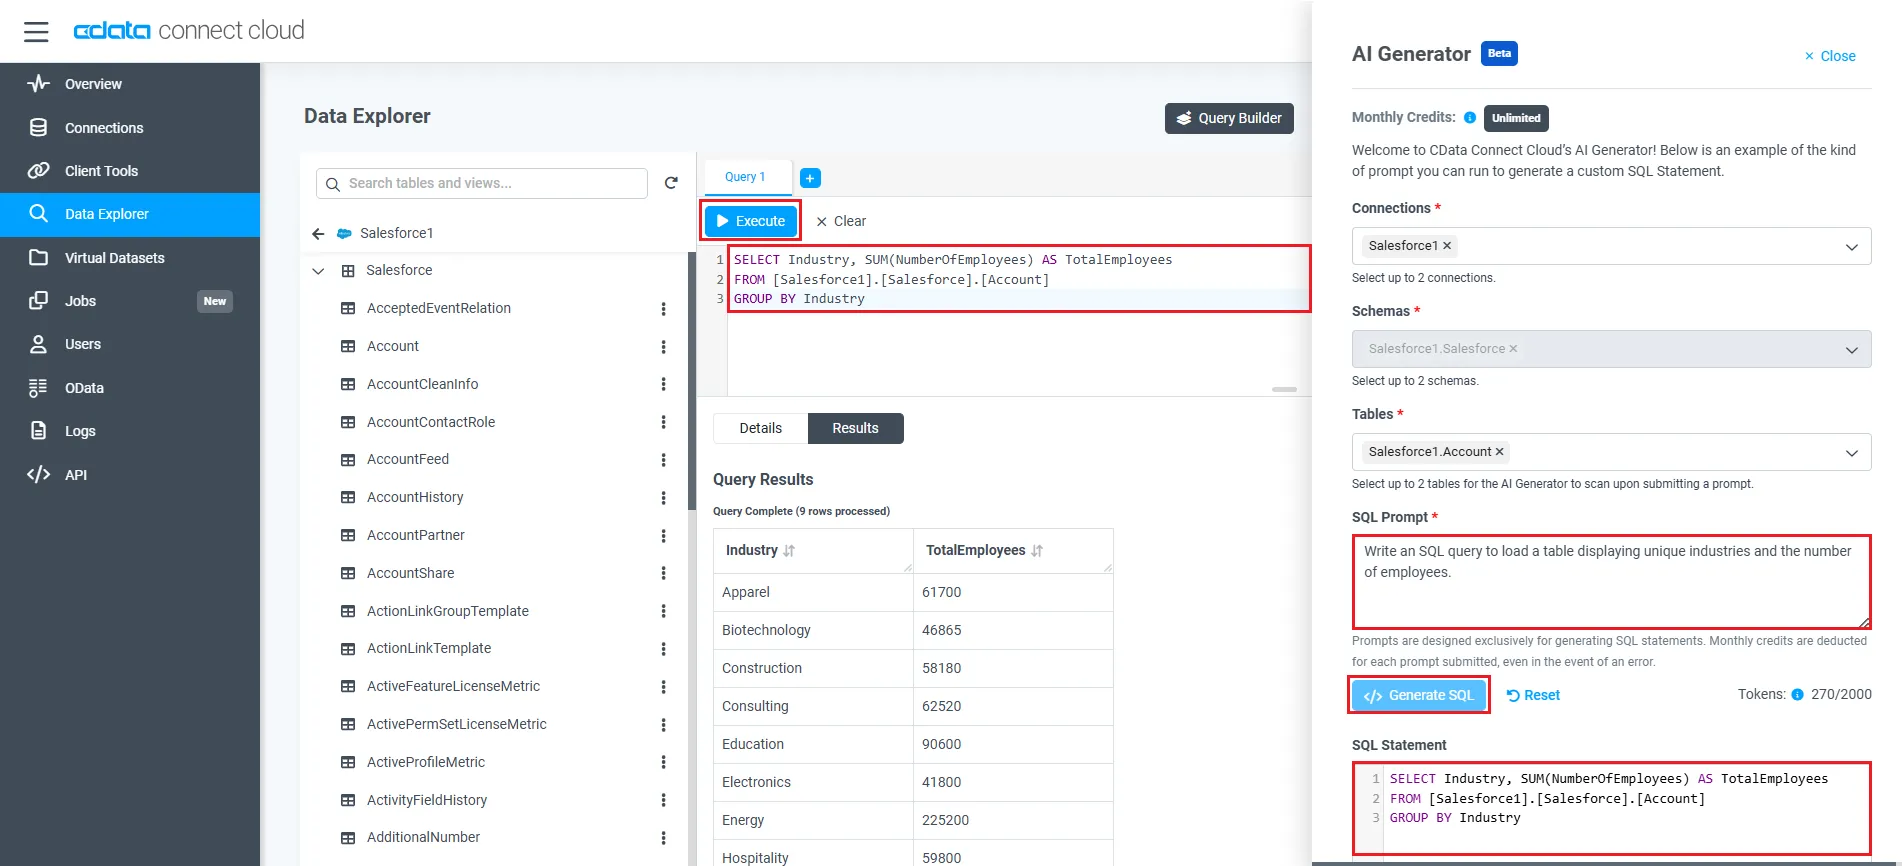
Depending on your use case, you can also generate the desired SQL query using the Playground or Query Builder features of CData Connect AI
Live access to Linear data from cloud applications
At this stage, you have established a direct, cloud-to-cloud connection to live Linear data in Geckoboard. This enables you to create dashboards to monitor and visualize your data seamlessly.
For more details on accessing live data from over 100 SaaS, Big Data, and NoSQL sources through cloud applications like Geckoboard, visit our Connect AI page.