




Build Dashboards with Linear Data in Dundas BI

The CData ODBC Driver for Linear enables access to live data from Linear under the ODBC standard, allowing you work with Linear data in a wide variety of BI, reporting, and ETL tools and directly, using familiar SQL queries. This article shows how to connect to Linear data as a generic ODBC Data Provider and create charts, reports, and dashboards based on Linear data in Dundas BI.
Connect to Linear Data
- If you have not already done so, provide values for the required connection properties in the data source name (DSN). You can configure the DSN using the built-in Microsoft ODBC Data Source Administrator. This is also the last step of the driver installation. See the "Getting Started" chapter in the Help documentation for a guide to using the Microsoft ODBC Data Source Administrator to create and configure a DSN.
You can authenticate to Linear with a personal API key or with OAuth 2.0. The API key is the simplest option for connecting with your own Linear account.
Authenticating with an API Key
Set the following connection properties:
- AuthScheme: Set this to APIKey.
- APIKey: A Linear personal API key.
To create a personal API key, log in to Linear, open Settings > Security & access > Personal API keys, select New API key, and create it. Copy the key immediately, because Linear shows it only once.
Authenticating with OAuth
OAuth requires a custom OAuth application registered in Linear (Settings > API > OAuth applications), which provides the OAuthClientId and OAuthClientSecret. Two flows are supported:
- Authorization code: Set AuthScheme to OAuth, InitiateOAuth to GETANDREFRESH, and provide OAuthClientId, OAuthClientSecret, and the CallbackURL defined in your application (e.g., http://localhost:33333). The driver opens Linear in your browser so you can grant access.
- Client credentials: Set AuthScheme to OAuthClient and provide OAuthClientId and OAuthClientSecret. This authenticates the application itself, with no browser interaction, and suits machine-to-machine integrations.
By default, the driver requests the read,write scopes. The driver refreshes the access token automatically when it expires.
When you configure the DSN, you may also want to set the Max Rows connection property. This will limit the number of rows returned, which is especially helpful for improving performance when designing reports and visualizations.
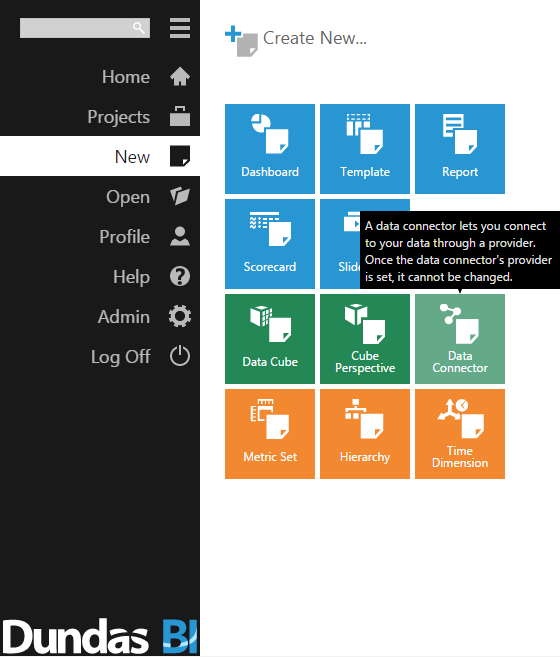
- Open the Dundas BI interface, open the menu, and click New Data Connector.
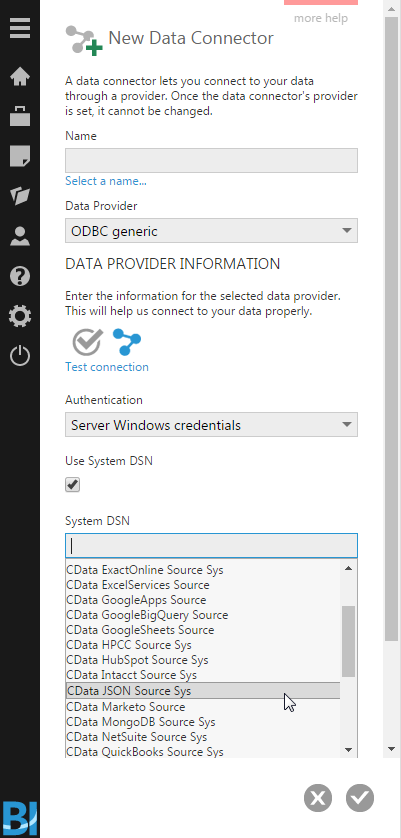
- Configure the Dundas BI Data Connector:
- Name the Data Connector.
- Select "ODBC generic" as the Data Provider.
- Check the "Use System DSN" checkbox.
- Select the appropriate System DSN.
Add Linear Data to a Dashboard
You are now ready to create a dashboard with Linear data.
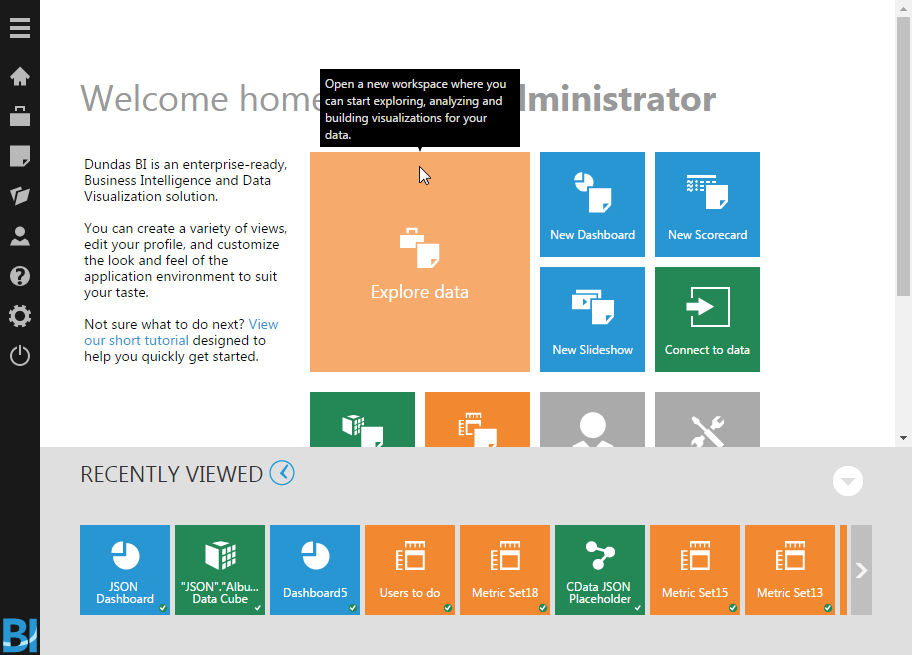
- Navigate to the Home page.
- Click Explore Data.
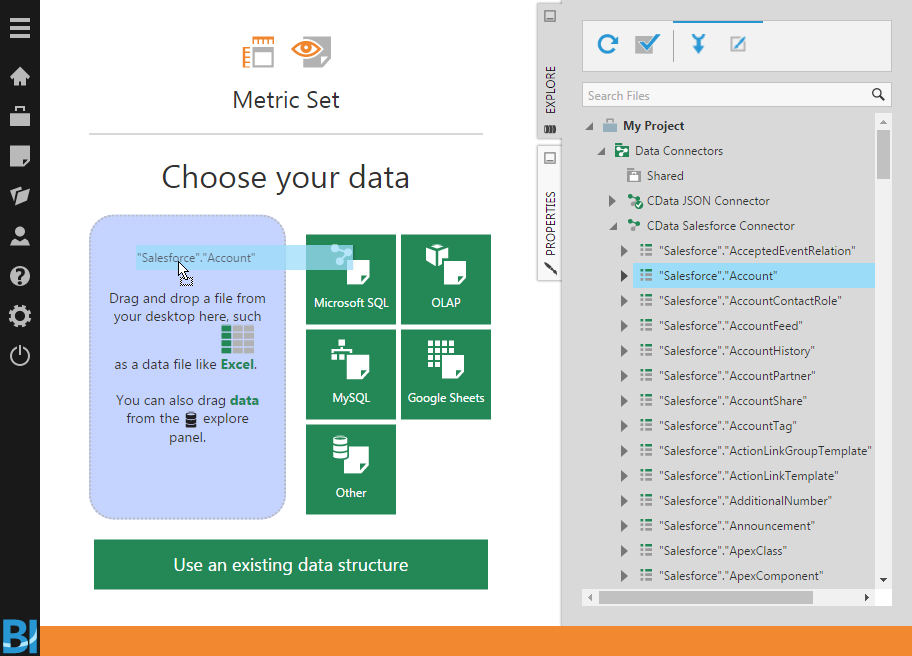
- Expand the appropriate Data Connector.
- Drag the relevant data from the Connector to the panel.
- You can select an entire "table" to add, but you may need to remove Measures/Rows from the Metric Set to build an appropriate visualization. Alternatively, you can select only the fields you wish to include in the visualization.
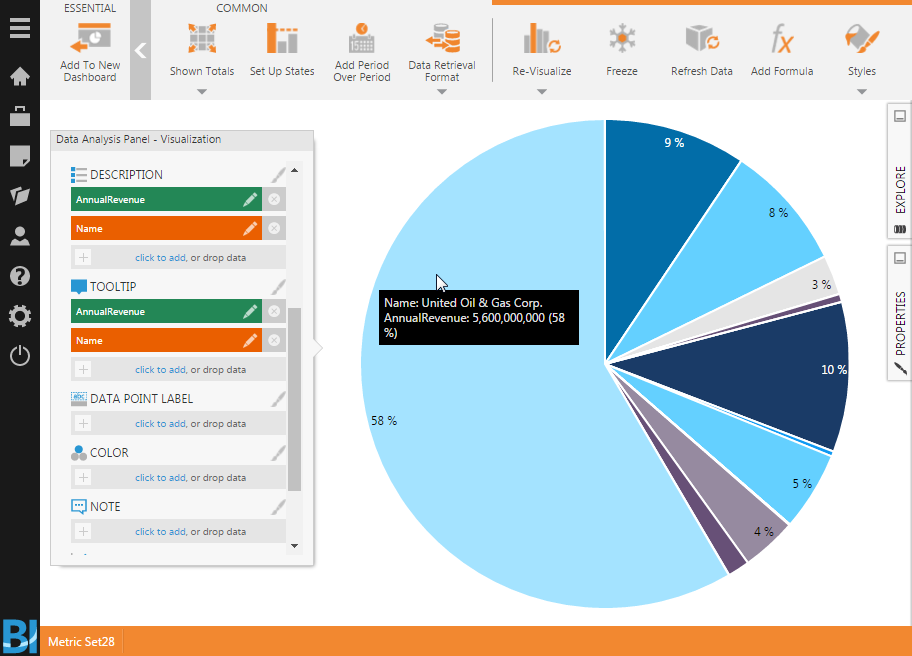
- With the fields selected, you can add any filters or conditions on the Measures and Rows, further customizing the visualization.
- Click Re-visualize from the menu bar and select the appropriate visualization for the data.
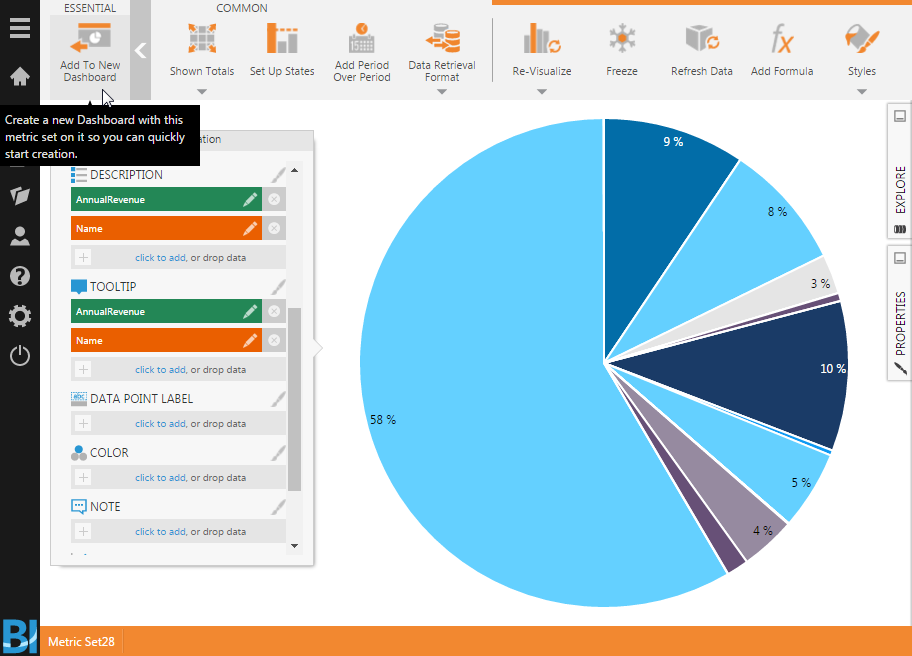
- Click Add To New Dashboard to add the visualization to a new dashboard.
- Configure the dashboard, creating dynamic visualizations of Linear data.
Ready to get started?
Download a free trial of the Linear ODBC Driver to get started:
Download NowLearn more:
 Linear ODBC Driver
The Linear ODBC Driver is a powerful tool that allows you to connect with live data from Linear, directly from any applications that support ODBC connectivity.
Access Linear data like you would a database - read Linear AgentSession, Comment, Customer, Cycle, Initiative, Integration, Issue, ProjectStatus, Release, Team, User, etc. through a standard ODBC Driver interface.