




Visualize Live Linear Data in Tableau

Tableau is a visual analytics platform transforming the way businesses use data to solve problems. When paired with the CData Tableau Connector for Linear, you can easily get access to live Linear data within Tableau. This article shows how to connect to Linear in Tableau and build a simple chart.
The CData Tableau Connectors enable high-speed access to live Linear data in Tableau. Once you install the connector, you simply authenticate with Linear and you can immediately start building responsive, dynamic visualizations and dashboards. By surfacing Linear data using native Tableau data types and handling complex filters, aggregations, & other operations automatically, CData Tableau Connectors grant seamless access to Linear data.
NOTE: The CData Tableau Connectors require Tableau 2020.3 or higher. If you are using an older version of Tableau, you will need to use the CData JDBC Driver. If you wish to connect to Linear data in Tableau Cloud, you will need to use CData Connect AI.
Connect to Linear in Tableau
Open Tableau and click More under Connect -> To a Server. Select "Linear by CData," then configure the connection and click "Sign In."
You can authenticate to Linear with a personal API key or with OAuth 2.0. The API key is the simplest option for connecting with your own Linear account.
Authenticating with an API Key
Set the following connection properties:
- AuthScheme: Set this to APIKey.
- APIKey: A Linear personal API key.
To create a personal API key, log in to Linear, open Settings > Security & access > Personal API keys, select New API key, and create it. Copy the key immediately, because Linear shows it only once.
Authenticating with OAuth
OAuth requires a custom OAuth application registered in Linear (Settings > API > OAuth applications), which provides the OAuthClientId and OAuthClientSecret. Two flows are supported:
- Authorization code: Set AuthScheme to OAuth, InitiateOAuth to GETANDREFRESH, and provide OAuthClientId, OAuthClientSecret, and the CallbackURL defined in your application (e.g., http://localhost:33333). The driver opens Linear in your browser so you can grant access.
- Client credentials: Set AuthScheme to OAuthClient and provide OAuthClientId and OAuthClientSecret. This authenticates the application itself, with no browser interaction, and suits machine-to-machine integrations.
By default, the driver requests the read,write scopes. The driver refreshes the access token automatically when it expires.
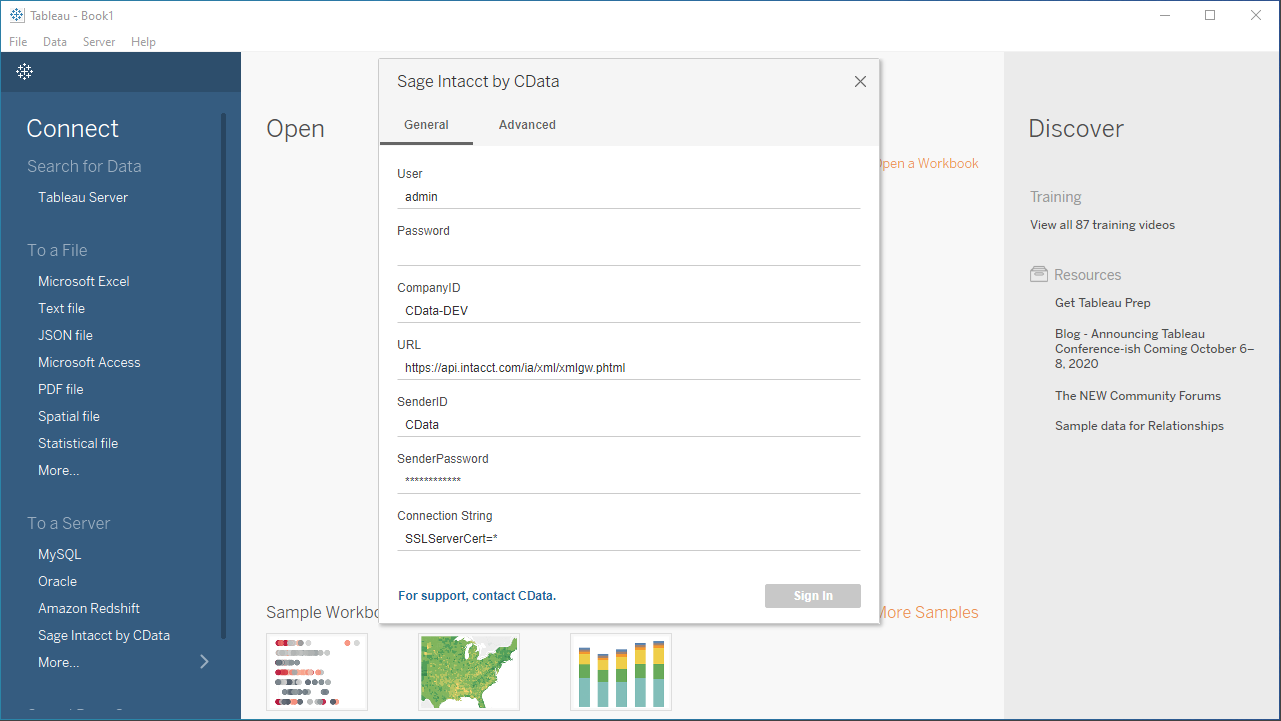
Discover Schemas and Query Data
- Select CData from the Database pull-down menu.
- Select Linear from the Schema pull-down menu.
- Drag the tables and views you wish to visualize onto the join area. You can include multiple tables.
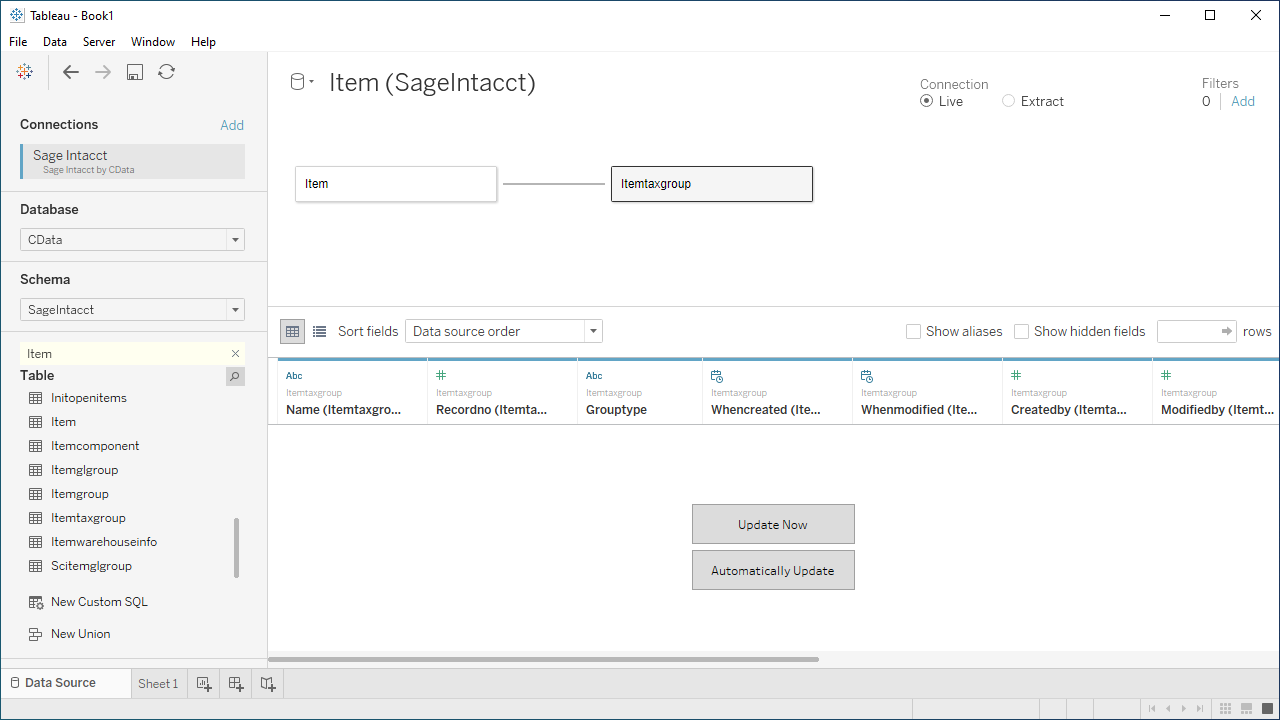
- Select Update Now or Automatically Update. Update Now lets you preview the first 10,000 rows of the data source (or enter the number of rows you want to see in the Rows text box). Automatically Update automatically reflects the changes in the preview area.
- Click the tab for your worksheet. Columns are listed as Dimensions and Measures, depending on the data type. The CData Tableau Connector discovers data types automatically, allowing you to leverage the powerful data processing and visualization features of Tableau.
- Drag a field from the Dimensions or Measures area to Rows or Columns. Tableau creates column or row headers.
- Select one of the chart types from the Show Me tab. Tableau displays the chart type that you selected.
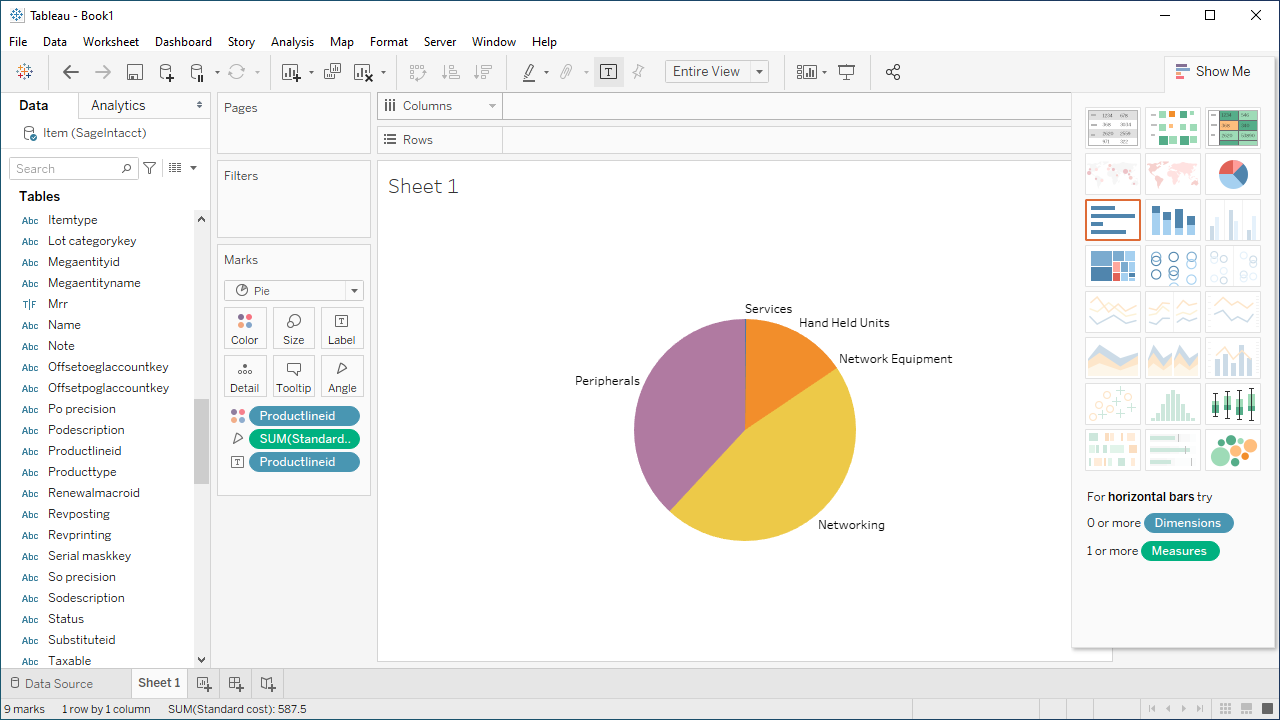
Using the CData Tableau Connector for Linear with Tableau, you can easily create robust visualizations and reports on Linear data. Download a free, 30-day trial and get started today.
Ready to get started?
Download a free trial of the Linear Tableau Connector to get started:
Download NowLearn more:
 Linear Tableau Connector
The fastest and easiest way to connect Tableau to Linear data. Includes comprehensive high-performance data access, real-time integration, extensive metadata discovery, and robust SQL-92 support.