Integrate with Pushover Data in JReport Designer

The CData JDBC Driver for Pushover data enables access to live data from dashboards and reports as if Pushover were a relational database, allowing you to query Pushover data using familiar SQL queries. This article shows how to connect to Pushover data as a JDBC data source and create reports based on Pushover data in JReport Designer.
Connect to Pushover Data
- Edit C:\JReport\Designer\bin\setenv.bat to add the location of the JAR file to the ADDCLASSPATH variable:
...
set ADDCLASSPATH=%JAVAHOME%\lib\tools.jar;C:\Program Files\CData\CData JDBC Driver for Pushover 2016\lib\cdata.jdbc.api.jar;
...
- Create a new data source by clicking File New Data Source.
- In the resulting dialog, create a name for the data source (CData JDBC Driver for Pushover), select JDBC, and click OK.
- In the Get JDBC Connection Information dialog you will configure your connection to the JDBC driver:
- Driver: Be sure that the Driver box is checked and fill in the name of the class for the driver:
cdata.jdbc.api.APIDriver - URL: Enter the JDBC URL. This starts with jdbc:api: and is followed by a semicolon-separated list of connection properties.
Start by setting the Profile connection property to the location of the Pushover Profile on disk (e.g. C:\profiles\Pushover.apip). Next, set the ProfileSettings connection property to the connection string for Pushover (see below).
Pushover API Profile Settings
Pushover uses API Key authentication. Your Pushover Application API Token is used to authenticate all requests. You can create and manage API tokens in the Pushover dashboard at pushover.net by registering an application under Settings > Your Applications.
After setting the following connection properties, you are ready to connect:
- AuthScheme: Set this to APIKey.
- APIKey: Set this to your 30-character Pushover Application API Token.
Built-in Connection String Designer
For assistance in constructing the JDBC URL, use the connection string designer built into the Pushover JDBC Driver. Either double-click the JAR file or execute the jar file from the command-line.
java -jar cdata.jdbc.api.jarFill in the connection properties and copy the connection string to the clipboard.
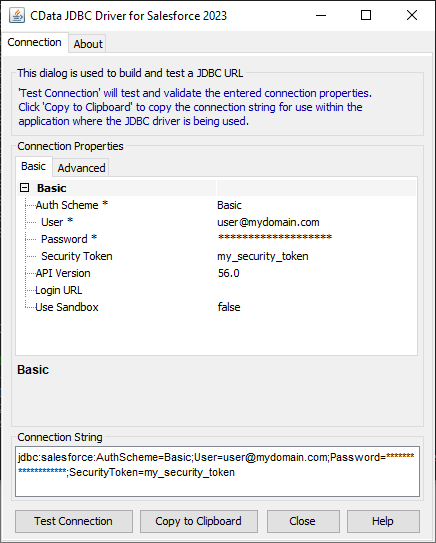
When you configure the JDBC URL, you may also want to set the Max Rows connection property. This will limit the number of rows returned, which is especially helpful for improving performance when designing reports and visualizations.
Below is a typical JDBC URL:
jdbc:api:Profile=C:\profiles\Pushover.apip;AuthScheme=APIKey;ProfileSettings='APIKey=your_application_token'; - User: The username to authenticate with; typically left blank.
- Password: The password to authenticate with; typically left blank.
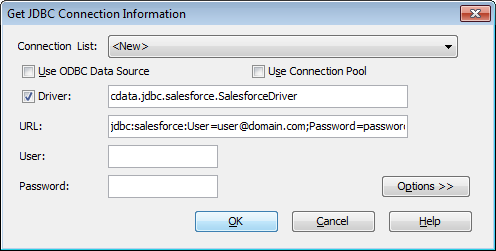
- Driver: Be sure that the Driver box is checked and fill in the name of the class for the driver:
In the Add Table dialog, select the tables you wish to include in your report (or in future reports using this data source) and click Add.
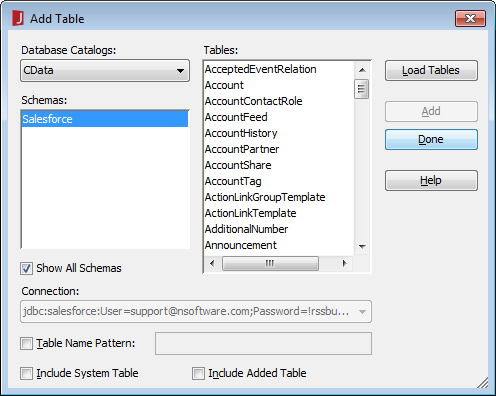
Click Done once the dialog has completed loading the tables.
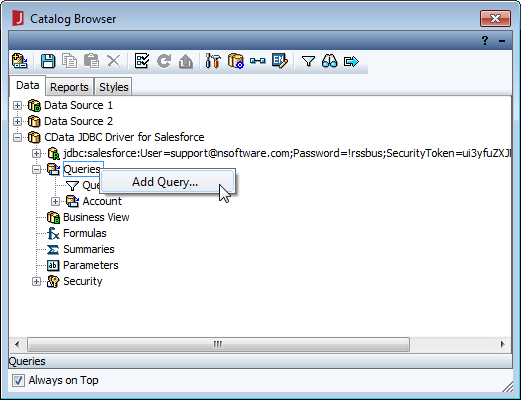
- In the Catalog Browser, you can create the queries that you will use to populate your reports. You can do this now, or after you create your report. In either case, expand () the data source (CData JDBC Driver for Pushover), right-click on Queries, and select Add Query.
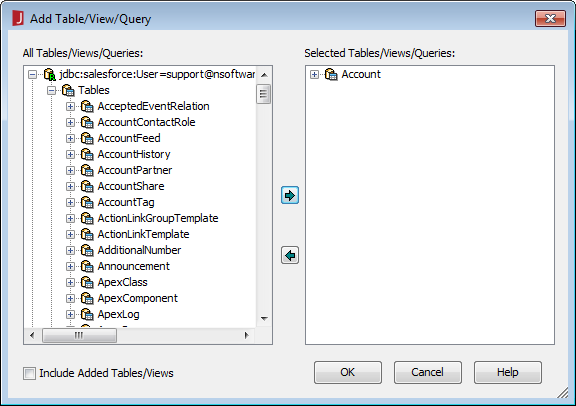
- In the Add Table/View/Query dialog, expand () the JDBC URL and Tables and select the table(s) you wish to use in the query and click OK.
- In the Query Editor dialog, you can select the columns you wish to include or simply click the SQL button and manually input your own query. For example:
SELECT User, Memo FROM GroupMembers WHERE GroupKey = 'your_group_key'
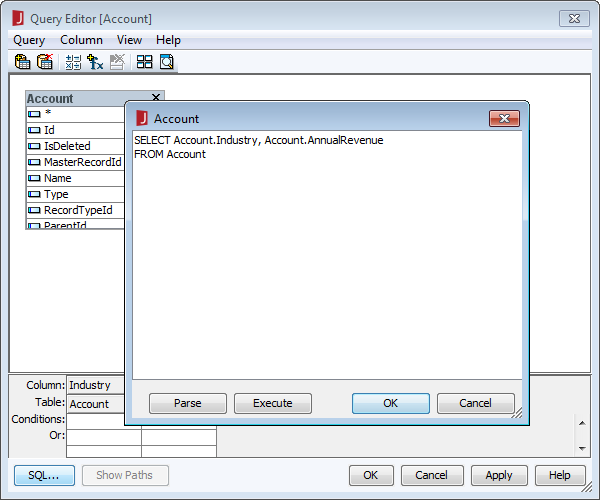
With the query built, click OK to close the Query Editor dialog. At this point you are ready to add Pushover data to a new or existing report.
NOTE: Now that the query is built, you can create a Business View based on the query. With a Business View, you can create Web reports or library components based on the query. For more information on this, refer to the JReport tutorials.
Add Pushover Data to a Report
You are now ready to create a report with Pushover data.
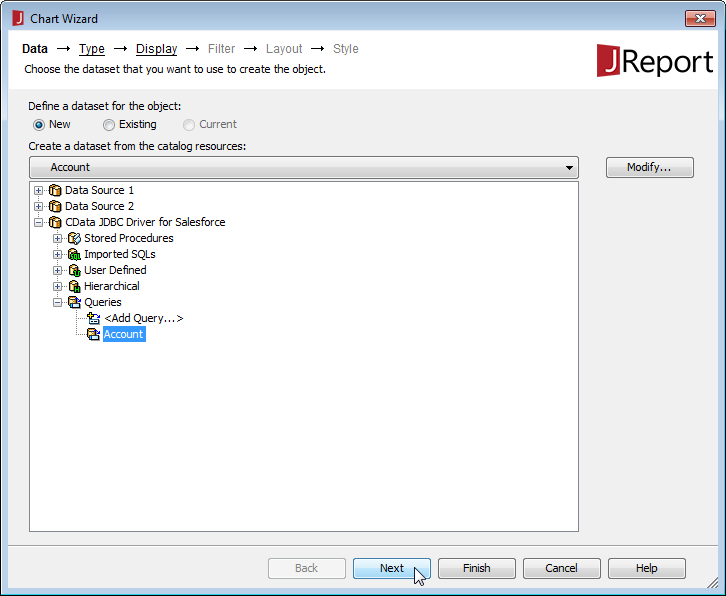
- Create a new report (File New Page Report) or open the Chart Wizard for an existing report.
- Select the Query (or create a new one; see above).
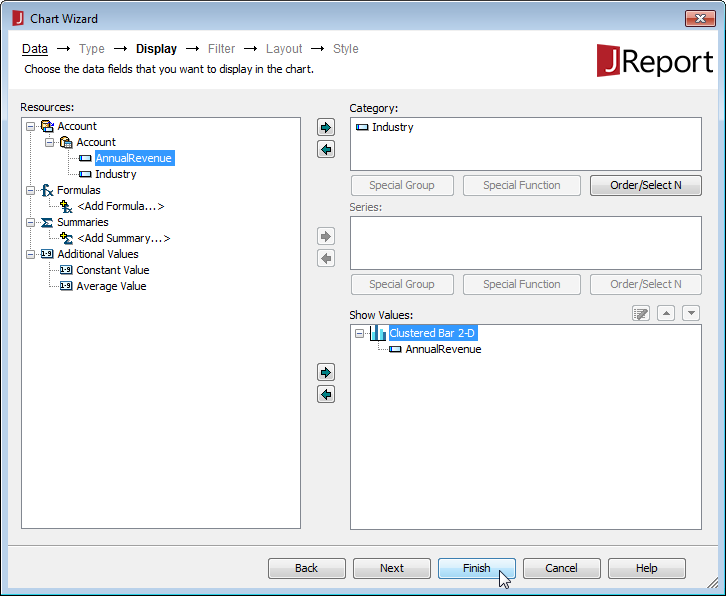
- Assign a Category and Value for the chart from the columns in your Query and click Finish.
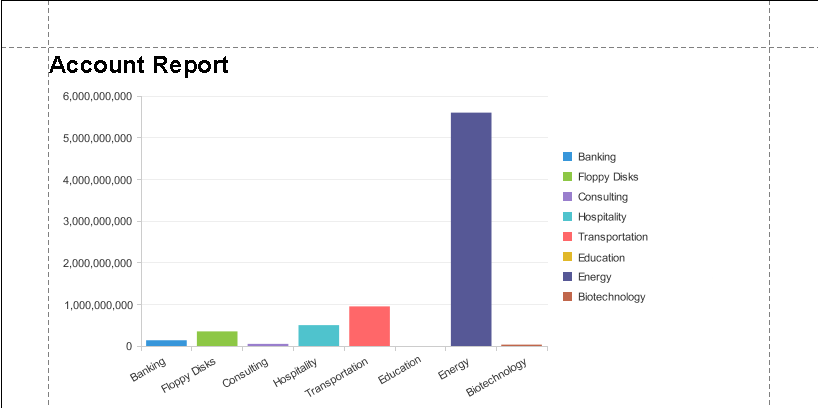
- Click the View tab for your report to see the chart.