Access Live Pushover Data in SAS JMP via ODBC

You can use the CData API Driver for ODBC to integrate live data into your statistical analysis with SAS JMP. The driver proxies your queries directly to the Pushover API, ensuring that your analysis reflects any changes to the data. The CData ODBC Driver supports the standard SQL used by JMP in the background as you design reports.
This article shows how to access Pushover data into a report and create data visualization. It also shows how to use SQL to query Pushover data from the JMP Query Builder.
Access Pushover Data as an ODBC Data Source
If you have not already, first specify connection properties in an ODBC DSN (data source name). This is the last step of the driver installation. You can use the Microsoft ODBC Data Source Administrator to create and configure ODBC DSNs.
Start by setting the Profile connection property to the location of the Pushover Profile on disk (e.g. C:\profiles\Pushover.apip). Next, set the ProfileSettings connection property to the connection string for Pushover (see below).
Pushover API Profile Settings
Pushover uses API Key authentication. Your Pushover Application API Token is used to authenticate all requests. You can create and manage API tokens in the Pushover dashboard at pushover.net by registering an application under Settings > Your Applications.
After setting the following connection properties, you are ready to connect:
- AuthScheme: Set this to APIKey.
- APIKey: Set this to your 30-character Pushover Application API Token.
When you configure the DSN, you may also want to set the Max Rows connection property. This will limit the number of rows returned, which is especially helpful for improving performance when designing reports and visualizations.
Import Pushover Data with the Query Builder
After you have created the Pushover DSN, you can use SQL to invoke the capabilities of the Pushover API. Follow the steps below to execute some supported queries in the Query Builder:
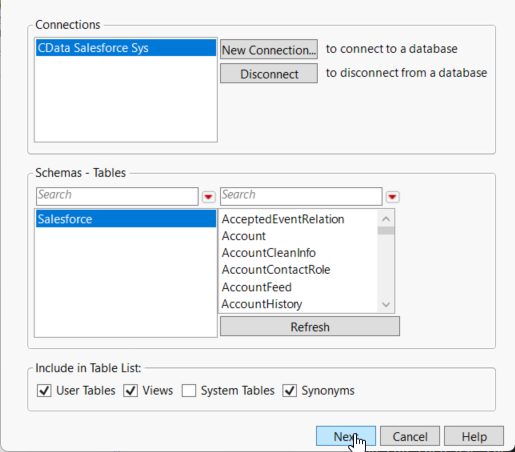
- In SAS JMP, click File -> Database -> Query Builder. The Select Database Connection dialog is displayed.
- Click New Connection.
- On the Machine Data Source tab, select the ODBC DSN you configured and then click Next.
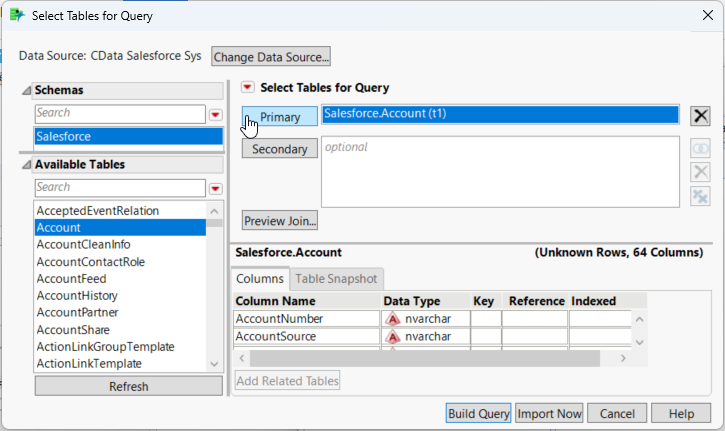
- The Select Tables for Query dialog is displayed and in the Available Tables section, select a table and click Primary. After choosing the primary table, click Build Query to open the Query Builder.
- As you drag Available Columns to the Included Columns tab, the underlying SQL query is updated and you can view the generated SQL Query in the SQL tab.
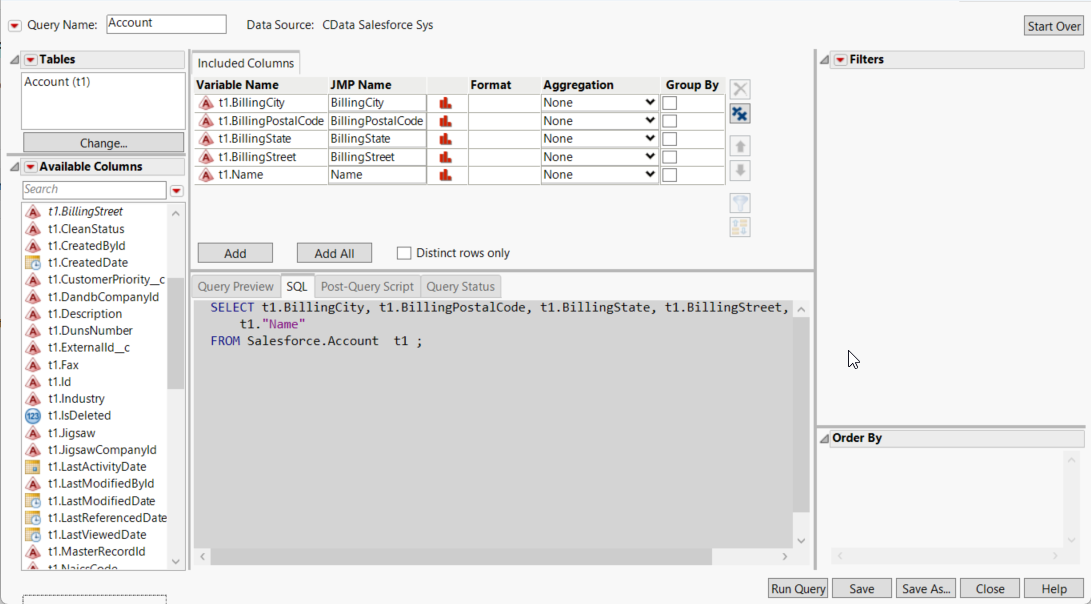
- Click Run Query to display the data.
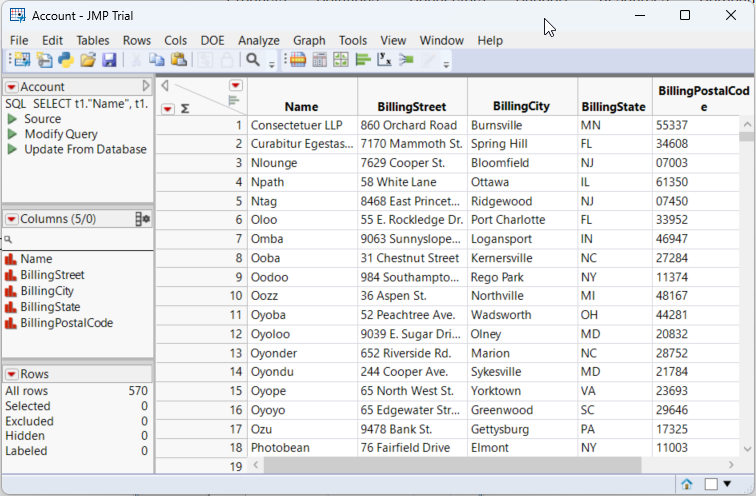
- To refresh the results with the current data, right-click Update from Database and click Run Script.
Visualize Pushover Data
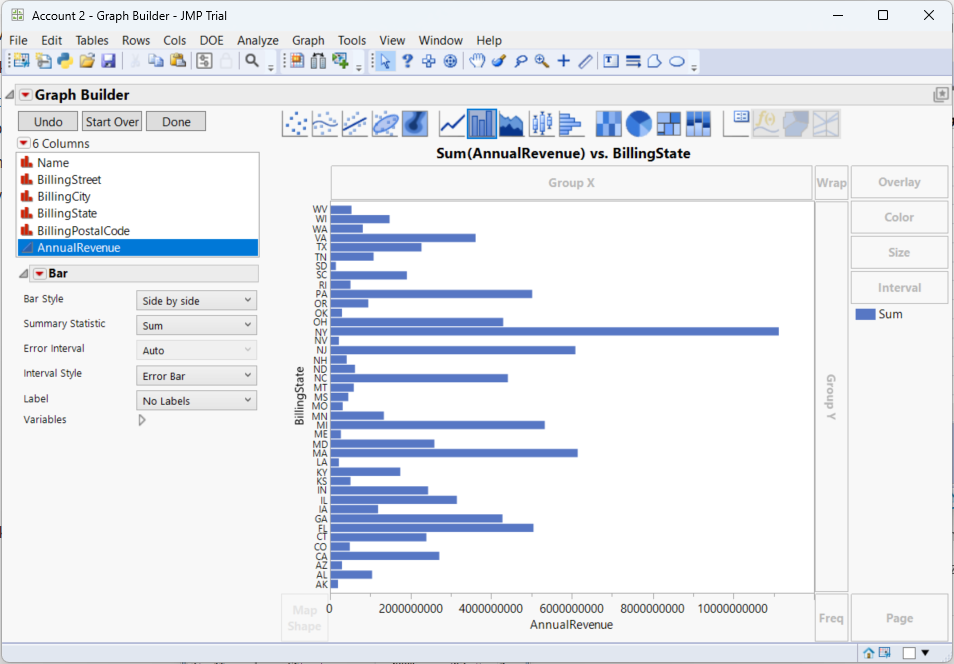
After importing, you can use the Graph Builder to create graphs visually. To open the Graph Builder, click the Graph Builder button in the toolbar.
- Drag a dimension column onto the x axis. For example, User.
- Drag a measure column onto the y axis. For example, Memo.
- Select a chart type. For example, a bar chart.