Use the CData ODBC Driver for Respond.io in SAS for Real-Time Reporting and Analytics

SAS is a software suite developed for advanced analytics, multivariate analysis, business intelligence, data management, and predictive analytics. When you pair SAS with the CData ODBC Driver for Respond.io, you gain database-like access to live Respond.io data from SAS, expanding your reporting and analytics capabilities. This article explains how to create a library for Respond.io in SAS and create a simple report based on real-time Respond.io data.
The CData ODBC Driver offers unmatched performance for interacting with live Respond.io data in SAS due to optimized data processing built into the driver. When you issue complex SQL queries from SAS to Respond.io, the driver pushes supported SQL operations, like filters and aggregations, directly to Respond.io and utilizes the embedded SQL engine to process unsupported operations (often SQL functions and JOIN operations) client-side. With built-in dynamic metadata querying, you can easily visualize and analyze Respond.io data in SAS.
Connect to Respond.io as an ODBC Data Source
Information for connecting to Respond.io follows, along with different instructions for configuring a DSN in Windows and Linux environments (the ODBC Driver for Respond.io must be installed on the machine hosting the SAS System).
Start by setting the Profile connection property to the location of the Respondio Profile on disk (e.g. C:\profiles\Respondio.apip). Next, set the ProfileSettings connection property to the connection string for Respondio (see below).
Respondio API Profile Settings
Respond.io uses API key authentication. To obtain an API key:
- Log in to your Respond.io account.
- Navigate to Settings in your workspace.
- Select Developer under the Integrations section.
- Copy the API key displayed on the page.
After obtaining your API key, set the following connection properties:
- AuthScheme: Set this to APIKey.
Set the following in the ProfileSettings connection property:
- APIKey: Set this to your Respond.io API key.
When you configure the DSN, you may also want to set the Max Rows connection property. This will limit the number of rows returned, which is especially helpful for improving performance when designing reports and visualizations.
Windows
If you have not already, first specify connection properties in an ODBC DSN (data source name). This is the last step of the driver installation. You can use the Microsoft ODBC Data Source Administrator to create and configure ODBC DSNs.
Linux
If you are installing the CData ODBC Driver for Respond.io in a Linux environment, the driver installation predefines a system DSN. You can modify the DSN by editing the system data sources file (/etc/odbc.ini) and defining the required connection properties.
/etc/odbc.ini
[CData API Sys]
Driver = CData ODBC Driver for Respond.io
Description = My Description
Profile = C:\profiles\Respondio.apip
AuthScheme = APIKey
ProfileSettings = 'APIKey = your_api_key'
For specific information on using these configuration files, please refer to the help documentation (installed and found online).
Create a Respond.io Library in SAS
Connect to Respond.io in SAS by adding a library based on the CData ODBC Driver for Respond.io.
- Open SAS and expand Libraries in the Explorer pane.
- In the Active Libraries window, right-click and select New.
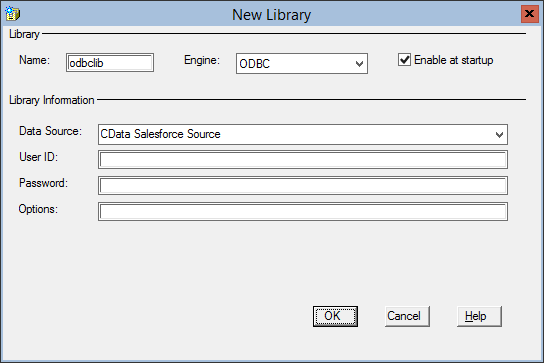
- Name your library (odbclib), select ODBC as the Engine, and click to Enable at startup (if you want the library to persist between sessions).
- Set Data Source to the DSN you previously configured and click OK.
Create a View from a Respond.io Query
SAS natively supports querying data either using a low-code, point-and-click Query tool or programmatically with PROC SQL and a custom SQL query. When you create a View in SAS, the defining query is executed each time the view is queried. This means that you always query live Respond.io data for reports, charts, and analytics.
Using the Query Tool
- In SAS, click Tools -> Query
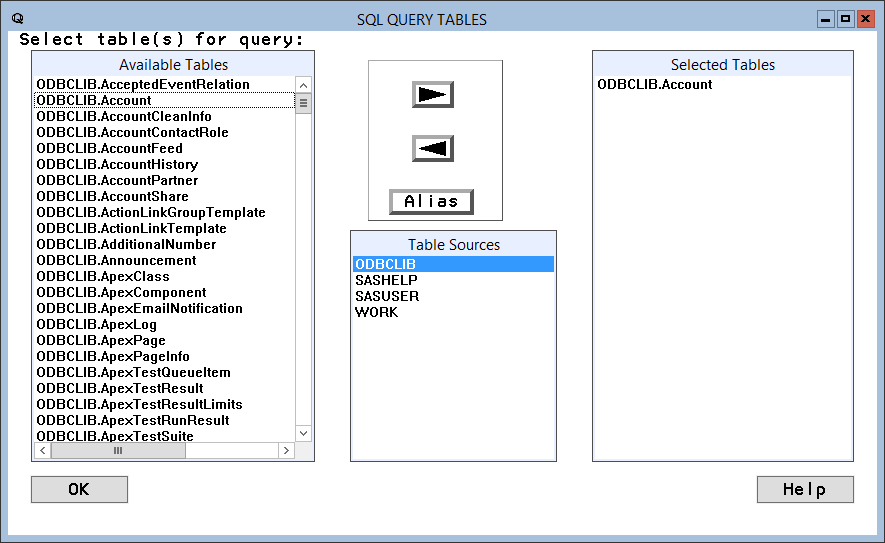
- Select the table sources and the table(s) you wish to pull data from. Then, click OK.
- Select columns and right-click to add filtering, ordering, grouping, etc.
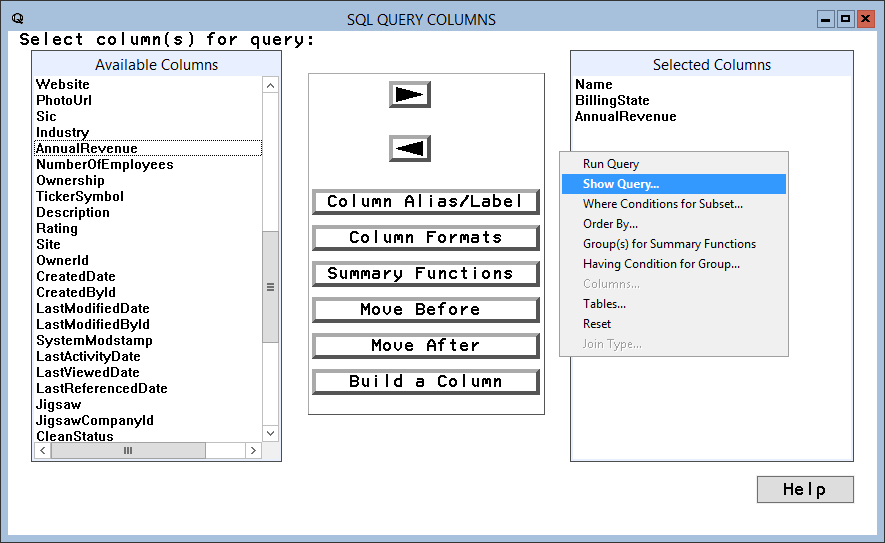
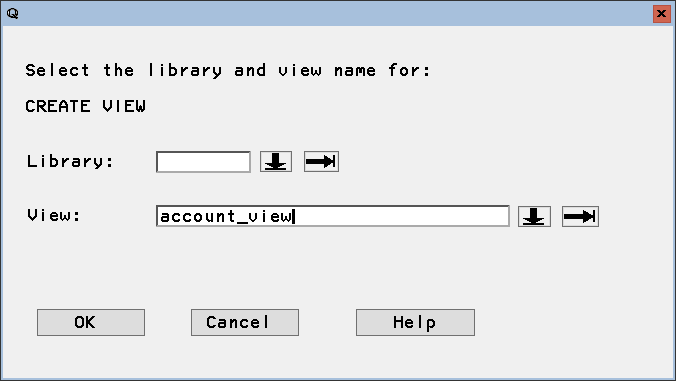
- Create a local view to contain the query results by right-clicking the SQL Query Tool window, selecting Show Query, and clicking Create View. Name the View and click OK.
Using PROC SQL
- In SAS, navigate to the Editor window.
- Use PROC SQL to query the data and create a local view.
NOTE: This procedure creates a view in the Work library. You can optionally specify a library in the create view statement.proc sql; create view contacts_view as select id, email from odbclib.contacts where Identifier = 'id:438180634'; quit; - Click Run -> Submit to execute the query and create a local view.
Report On or Visualize Respond.io Data in SAS
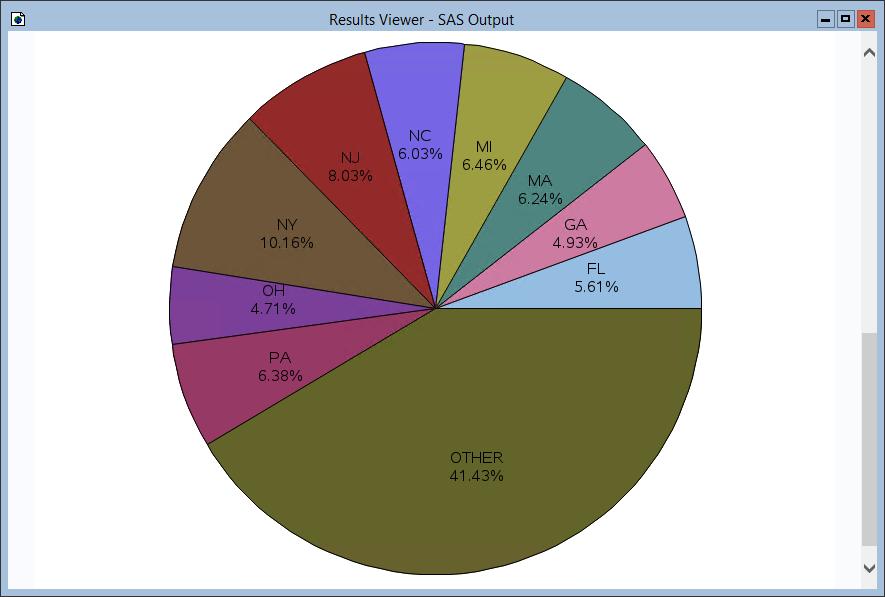
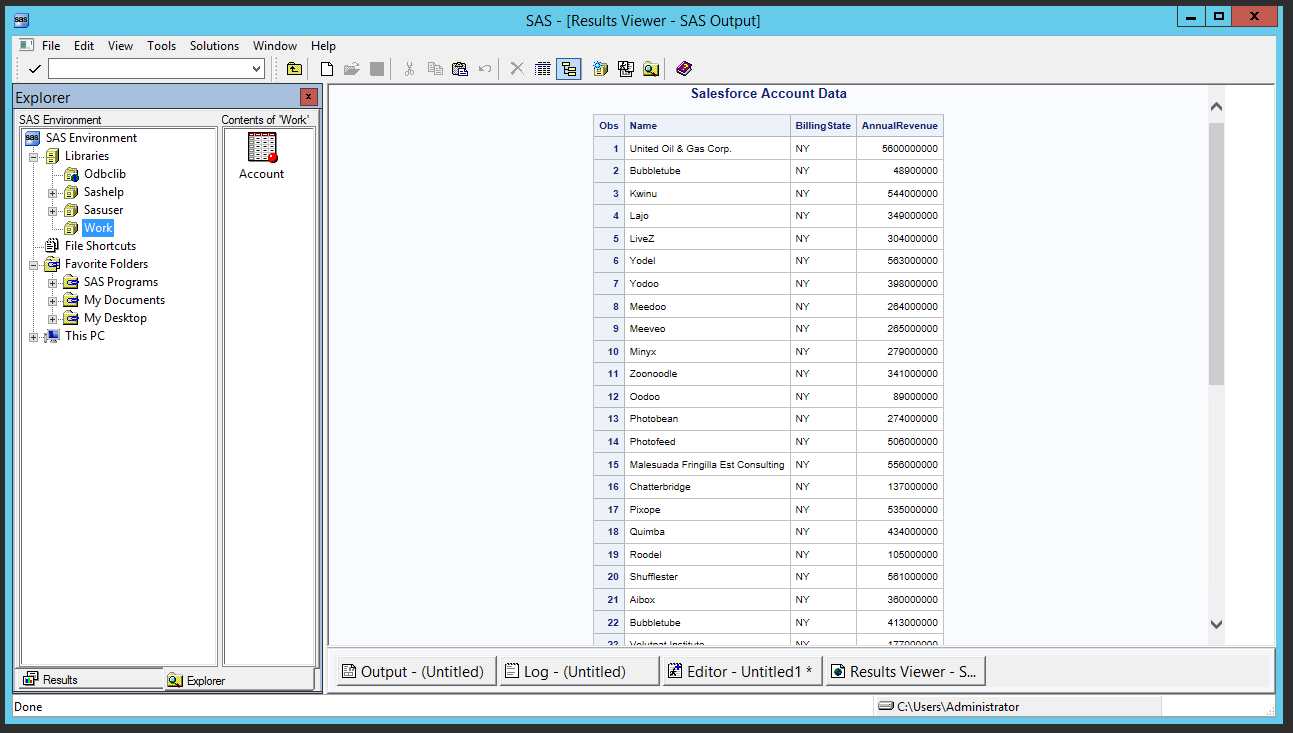
With a local view created, you can report, visualize, or otherwise analyze Respond.io data using the powerful SAS features. Print a simple report using PROC PRINT and create a basic graph based on the data using PROC GCHART.
Print an HTML Report
- In SAS, navigate to the Editor window.
- Use PROC PRINT to print an HTML report for the Respond.io Contacts data.
proc print data=contacts;
  title "Respond.io Contacts Data";
run;
Print a Chart
- In SAS, navigate to the Editor window.
- Use PROC GCHART to create a chart for the Contacts data.
proc gchart data=contacts;
  pie id / sumvar=email
      value=arrow
      percent=arrow
      noheading
      percent=inside plabel=(height=12pt)
      slice=inside value=none
      name='ContactsChart';
run;