




DataBind Sage X3 Cloud Data to the DevExpress Data Grid

The CData ADO.NET Provider for Sage X3 Cloud incorporates conventional ADO.NET data access components compatible with third-party controls. You can adhere to the standard ADO.NET data binding procedures to establish two-way access to real-time data through UI controls. This article will demonstrate the utilization of CData components for data binding with DevExpress UI Controls (Windows Forms and Web controls), specifically binding to a chart that visualizes live data.
Sage X3 Cloud uses the OAuth 2.0 Client Credentials flow, and an X-API-Key is also required for API access. Set AuthScheme to OAuth and specify the following connection properties:
- URL: The base URL of your Sage X3 Cloud instance.
- OAuthAccessTokenUrl: The OAuth token endpoint (e.g., https://your-auth-domain/oauth/token).
- OAuthClientId: Your OAuth application client ID.
- OAuthClientSecret: Your OAuth application client secret.
- Audience: The API audience value for the token request.
- XAPIKey: The X-API-Key provided by your Sage X3 Cloud administrator.
- Folder: The Sage X3 folder name (e.g., SEED). This folder is used as the default schema.
- Folders (optional): A comma-separated list of Sage X3 folders (e.g., SEED,PERF). Each folder is exposed as a separate schema, so you can query across folders with the Schema.Table syntax.
The driver obtains an access token with the Client Credentials flow and sends it with the X-API-Key on every API request. With InitiateOAuth set to GETANDREFRESH (the default), the driver acquires and refreshes the token automatically.
Windows Forms Controls
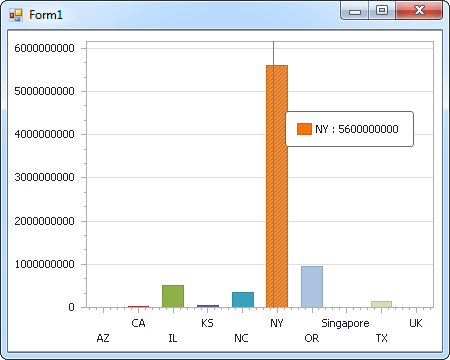
The code below shows how to populate a DevExpress chart with Sage X3 Cloud data. The SageX3CloudDataAdapter binds to the Series property of the chart control. The Diagram property of the control defines the x- and y-axes as the column names.
using (SageX3CloudConnection connection = new SageX3CloudConnection(
"AuthScheme=OAuth;URL=https://x3server/;OAuthAccessTokenUrl=https://auth-domain/oauth/token;OAuthClientId=your_client_id;OAuthClientSecret=your_client_secret;Audience=https://api-audience;XAPIKey=your_api_key;Folder=SEED;")) {
  SageX3CloudDataAdapter dataAdapter = new SageX3CloudDataAdapter(
  "SELECT BPCNUM, BPCNAM FROM BPCUSTOMER WHERE BPCNUM = 'MARTIN'", connection);

  DataTable table = new DataTable();
  dataAdapter.Fill(table);
  DevExpress.XtraCharts.Series series = new DevExpress.XtraCharts.Series();
  chartControl1.Series.Add(series);
  series.DataSource = table;
  series.ValueDataMembers.AddRange(new string[] { "BPCNAM" });
  series.ArgumentScaleType = DevExpress.XtraCharts.ScaleType.Qualitative;
  series.ArgumentDataMember = "BPCNUM";
  series.ValueScaleType = DevExpress.XtraCharts.ScaleType.Numerical;
  chartControl1.Legend.Visibility = DevExpress.Utils.DefaultBoolean.False;
  ((DevExpress.XtraCharts.SideBySideBarSeriesView)series.View).ColorEach = true;
}
Web Controls
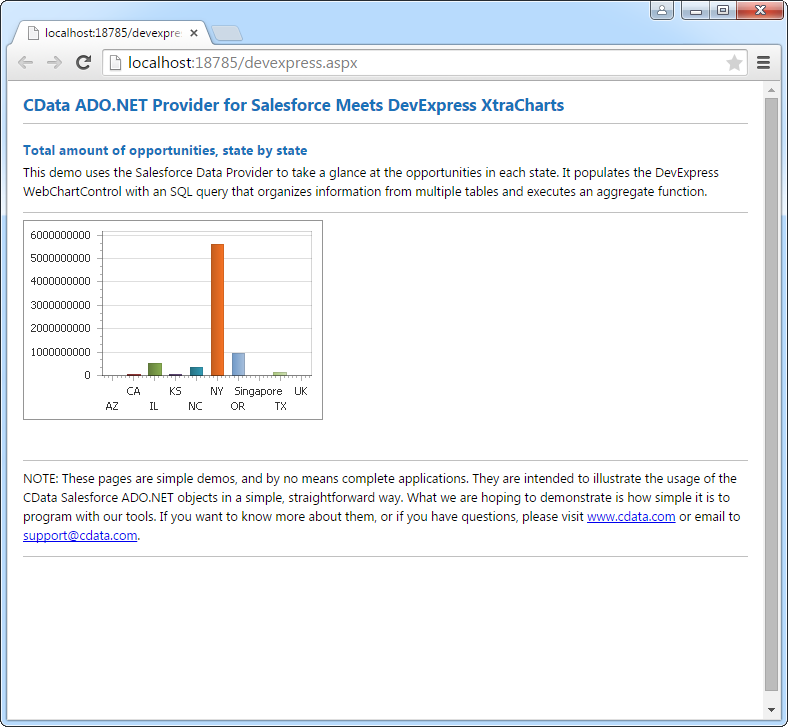
The code below shows how to populate a DevExpress Web control with Sage X3 Cloud data. The SageX3CloudDataAdapter binds to the Series property of the chart; the Diagram property defines the x- and y-axes as the column names.
using DevExpress.XtraCharts;

using (SageX3CloudConnection connection = new SageX3CloudConnection(
"AuthScheme=OAuth;URL=https://x3server/;OAuthAccessTokenUrl=https://auth-domain/oauth/token;OAuthClientId=your_client_id;OAuthClientSecret=your_client_secret;Audience=https://api-audience;XAPIKey=your_api_key;Folder=SEED;"))
{
  SageX3CloudDataAdapter SageX3CloudDataAdapter1 = new SageX3CloudDataAdapter("SELECT BPCNUM, BPCNAM FROM BPCUSTOMER WHERE BPCNUM = 'MARTIN'", connection);
  DataTable table = new DataTable();
  SageX3CloudDataAdapter1.Fill(table);
  DevExpress.XtraCharts.Series series = new Series("Series1", ViewType.Bar);
  WebChartControl1.Series.Add(series);
  series.DataSource = table;
  series.ValueDataMembers.AddRange(new string[] { "BPCNAM" });
  series.ArgumentScaleType = ScaleType.Qualitative;
  series.ArgumentDataMember = "BPCNUM";
  series.ValueScaleType = ScaleType.Numerical;
  ((DevExpress.XtraCharts.SideBySideBarSeriesView)series.View).ColorEach = true;
}
Ready to get started?
Download a free trial of the Sage X3 Cloud Data Provider to get started:
Download NowLearn more:
 Sage X3 Cloud ADO.NET Provider
Rapidly create and deploy powerful .NET applications that integrate with Sage X3 Cloud.